

Hi all, welcome to my first Weather Duck post. I just wanted to talk about todays Lake District cloud inversion and document the forecast for future reference.
Somewhere on this page, you’ll see a Skew-T Log-P diagram, I use this to analyse the vertical profile of the atmosphere at any location or time. This is provided by the amazing website Tropical Tidbits for free! https://www.tropicaltidbits.com/
In the diagram, you can see how the temperature line bends to the right as the pressure decreases (we are only really interested in the bottom of the red line as this is the lower atmosphere). The almost horizontal curve suggests lower temperatures at lower altitudes. This temperature inversion is the most important condition I look for when predicting cloud inversions. Near the bottom of the chart, the dew point line is very close to the temperature line, favourable for cloud formation.
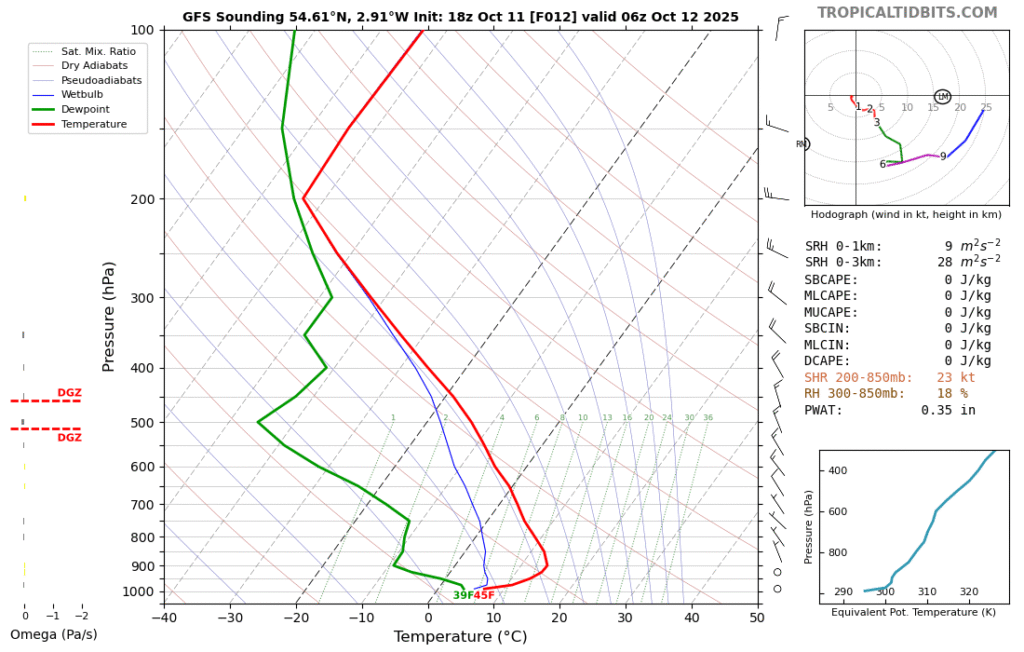
Forecast Analysis: Temperature Inversion Setup Skew-T explanation
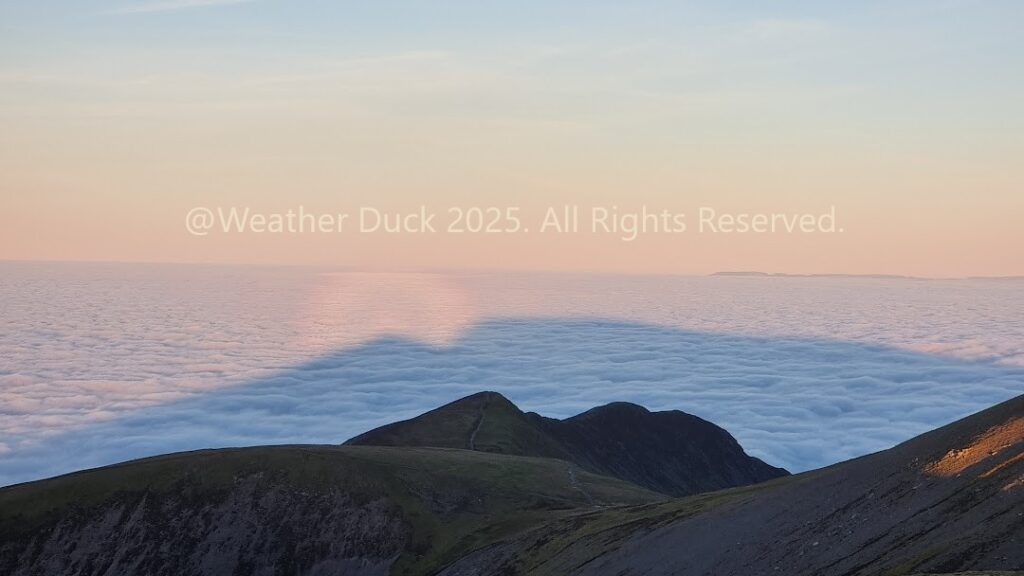
I decided on an early 4am start to reach the summit before sunrise. Most of the time the sun will start to heat the valley floor, causing the inversion to dissipate within a few hours. It always surprises me as you walk out of the dense cold fog into the crisp drier air above. The temperature change can be a couple of degrees as you climb. You end up shedding clothing layers as you go higher! This time I found the experience almost uncomfortable on my nostrils, they had grown accustomed to the moist fog.
Most forecasts predicted clear skies both on the mountain tops and in the valleys. It just shows how sometimes the algorithms can get it wrong. The result was the below for most of the early morning/day:
