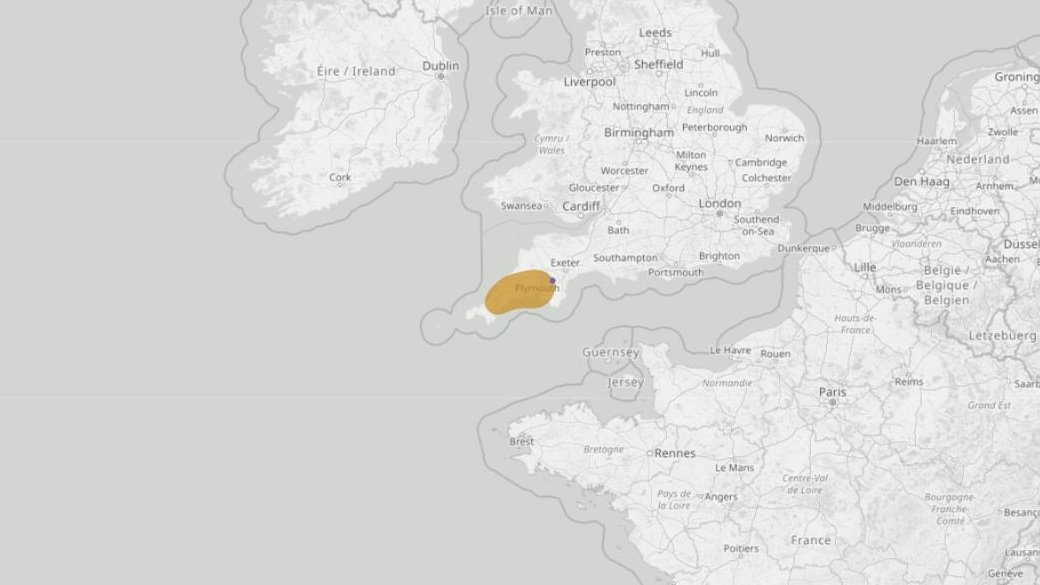
HISTORICAL CLOUD-INVERSION EVIDENCE
Today's production blob geometry applied to retained historical model inputs—with strong matches, weaker signals and misses kept together.
The purple point marks the observed location. Blue means Very likely, green Likely and amber Possible.
These 62 historical cloud-inversion replays use valid-time model inputs. They are not forecasts issued before every event and not an overall accuracy rate.
Important limitation: historical daily scores cannot prove the live email rule that requires two consecutive forecast updates. The complete forecast-proof reports are kept separately.
REPLAY GROUP · 26 EVENTS
26 events where the observation point sits inside a Very likely production-geometry blob in this historical replay.
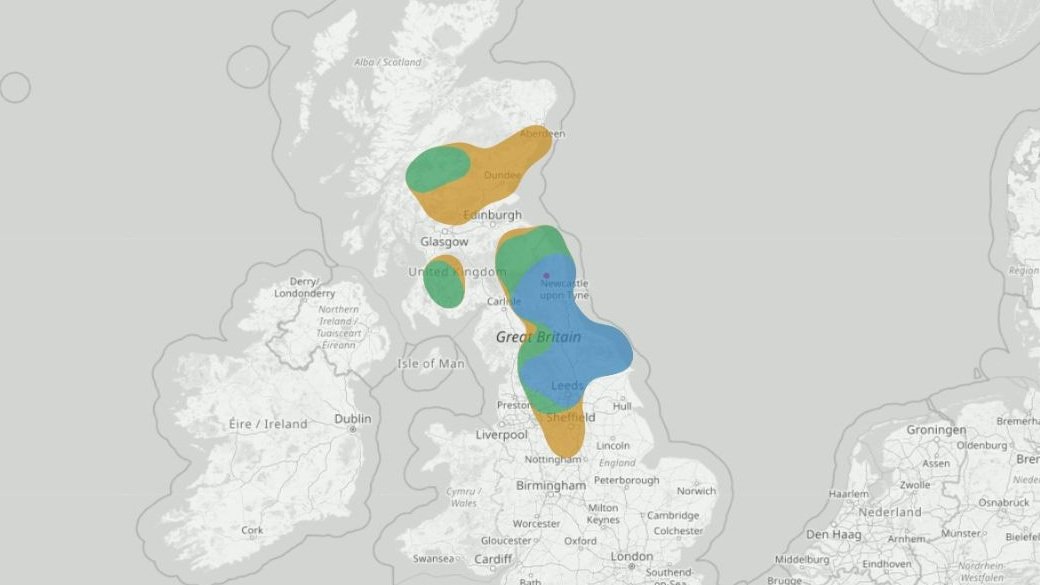
24 April 2026 · Very likely direct match
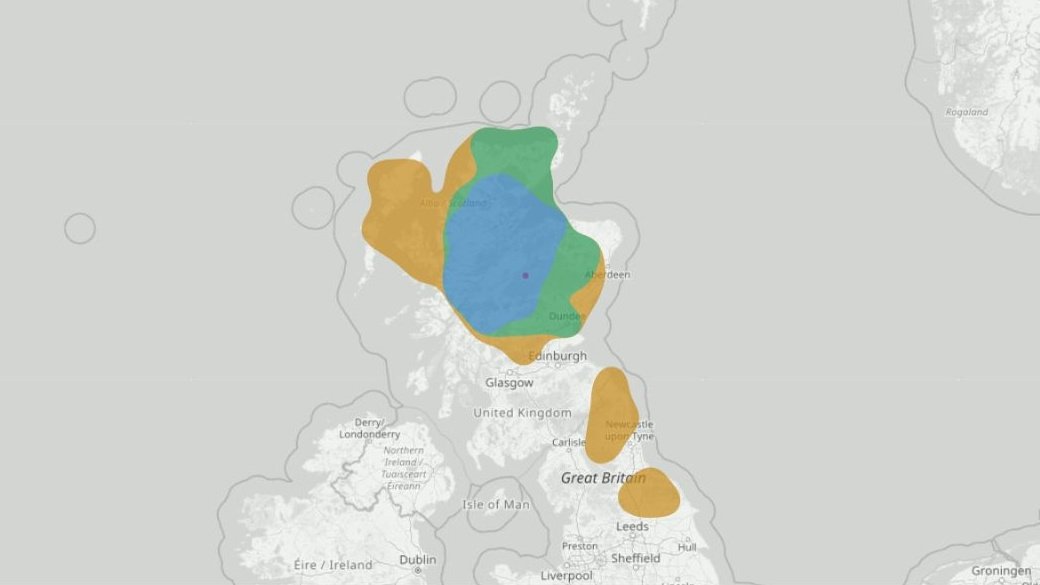
28 December 2025 · Very likely direct match · observation confidence 10/10
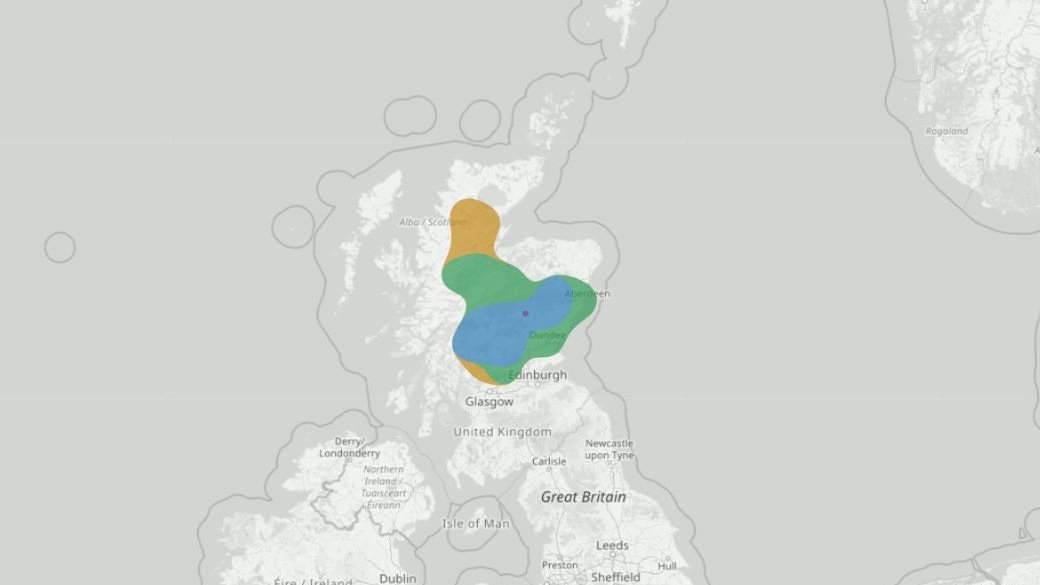
25 December 2025 · Very likely direct match · observation confidence 10/10
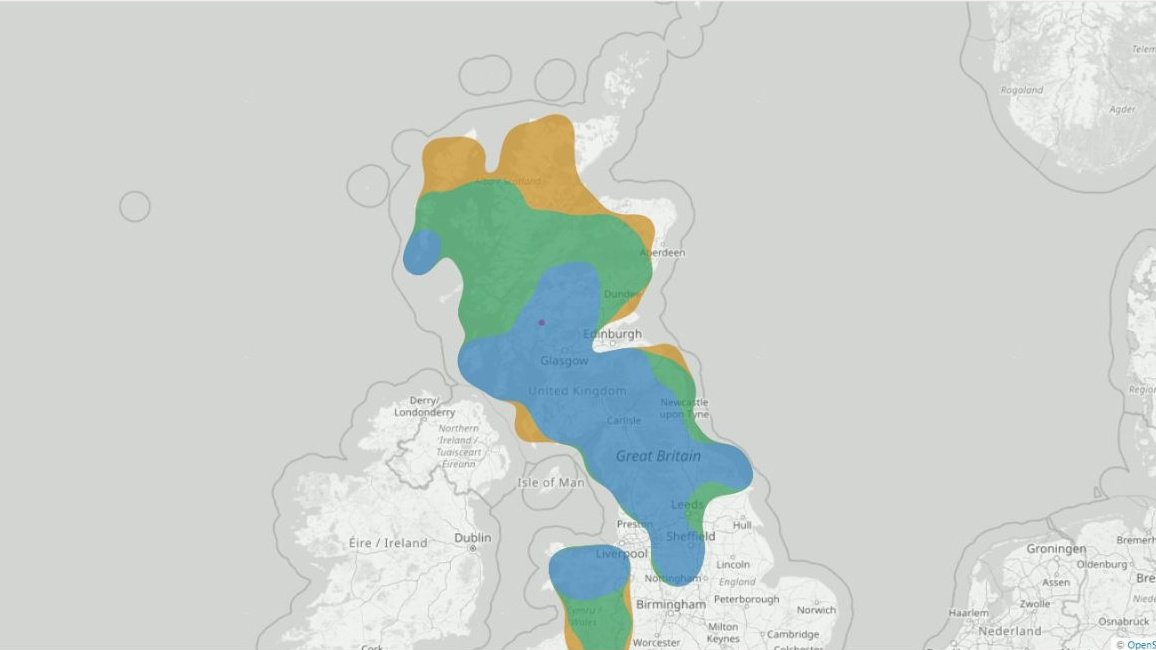
14 October 2025 · Very likely direct match · observation confidence 10/10
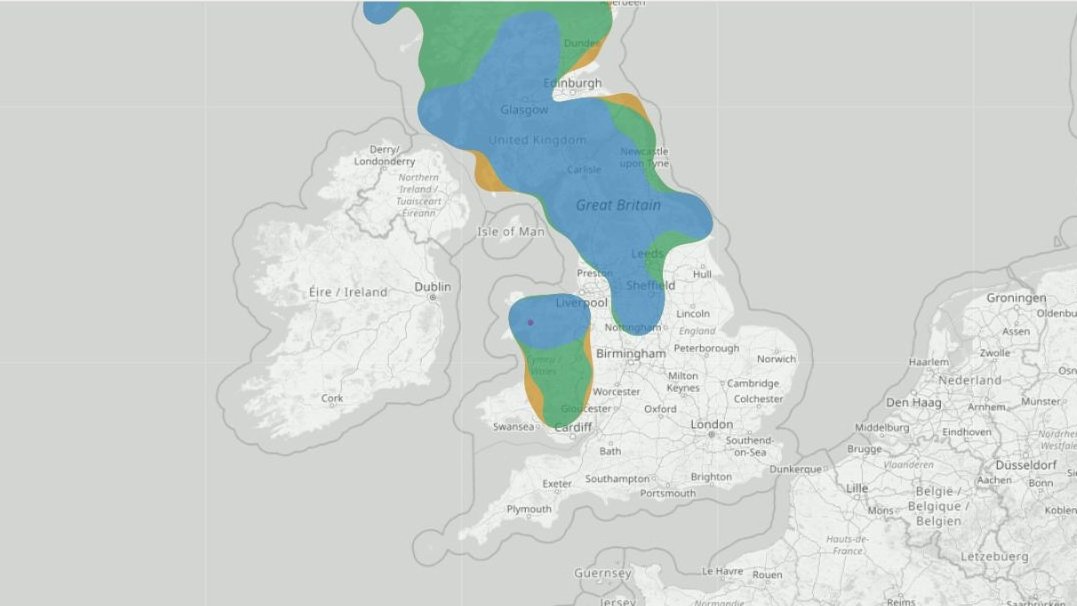
14 October 2025 · Very likely direct match · observation confidence 10/10
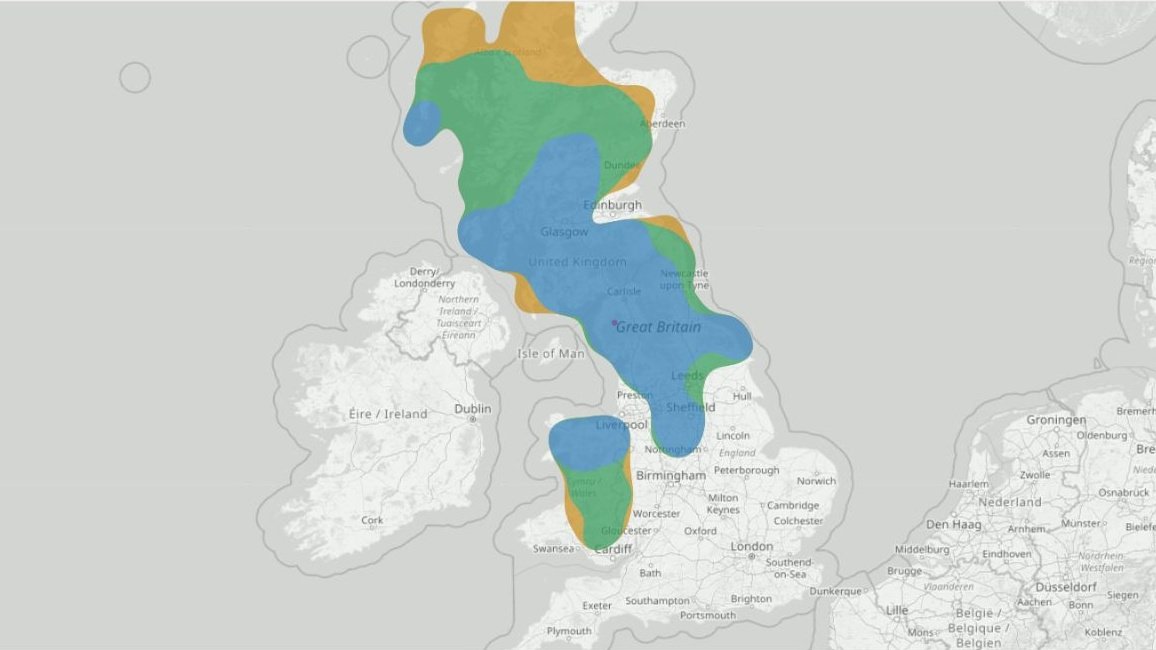
14 October 2025 · Very likely direct match · observation confidence 8/10
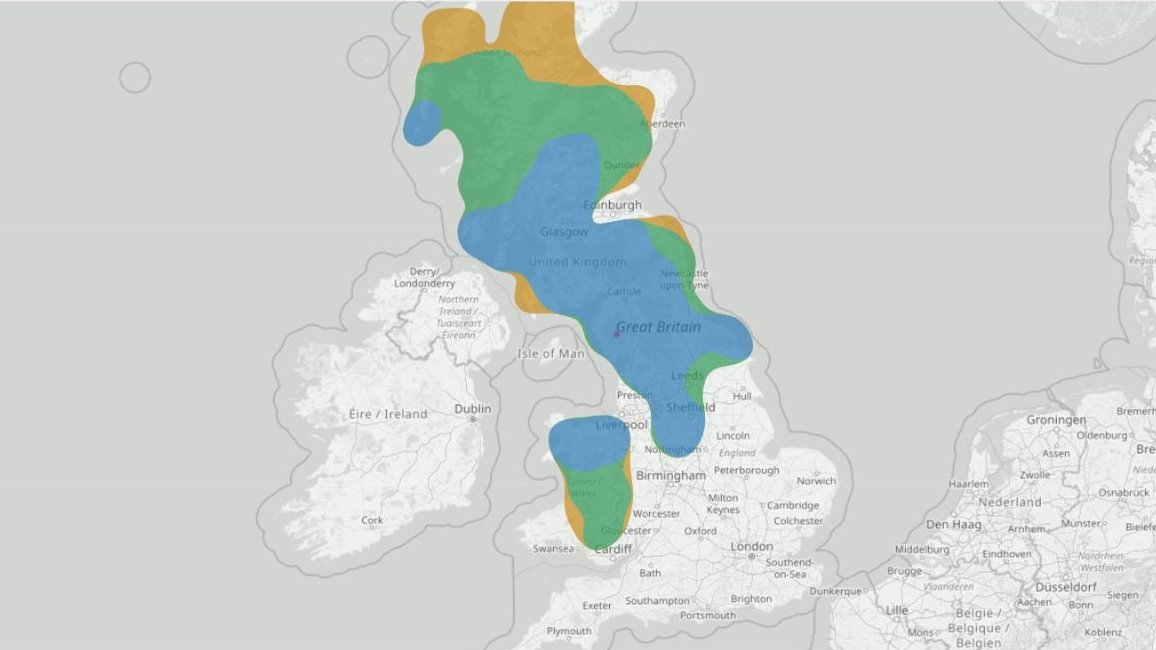
14 October 2025 · Very likely direct match · observation confidence 10/10
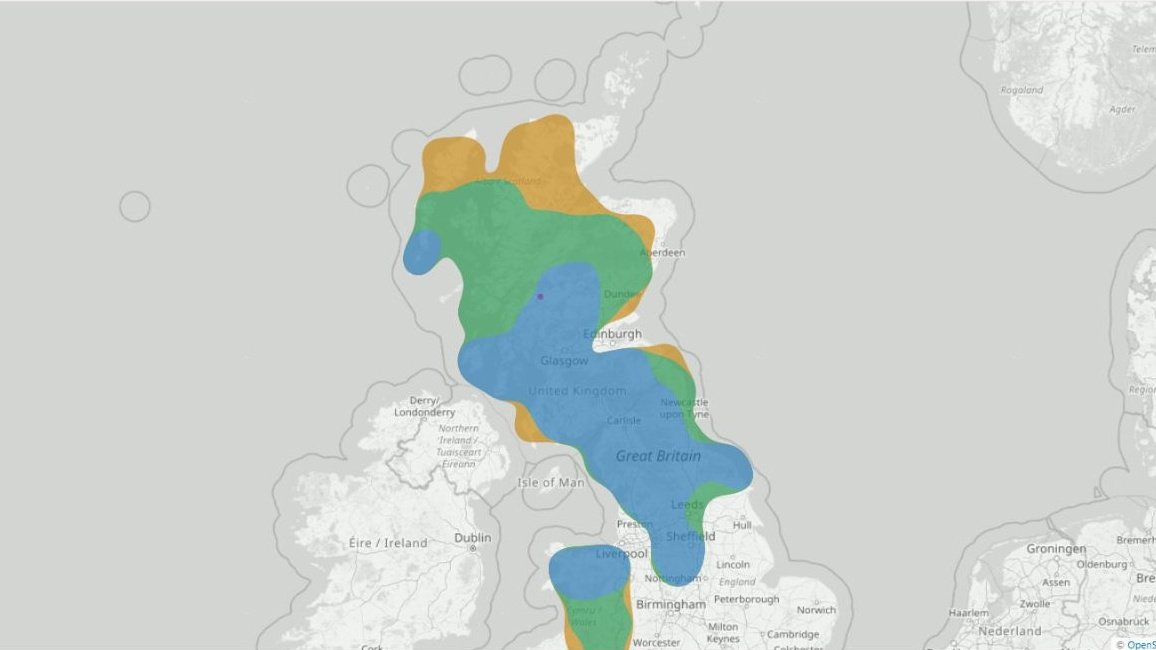
14 October 2025 · Very likely direct match · observation confidence 10/10
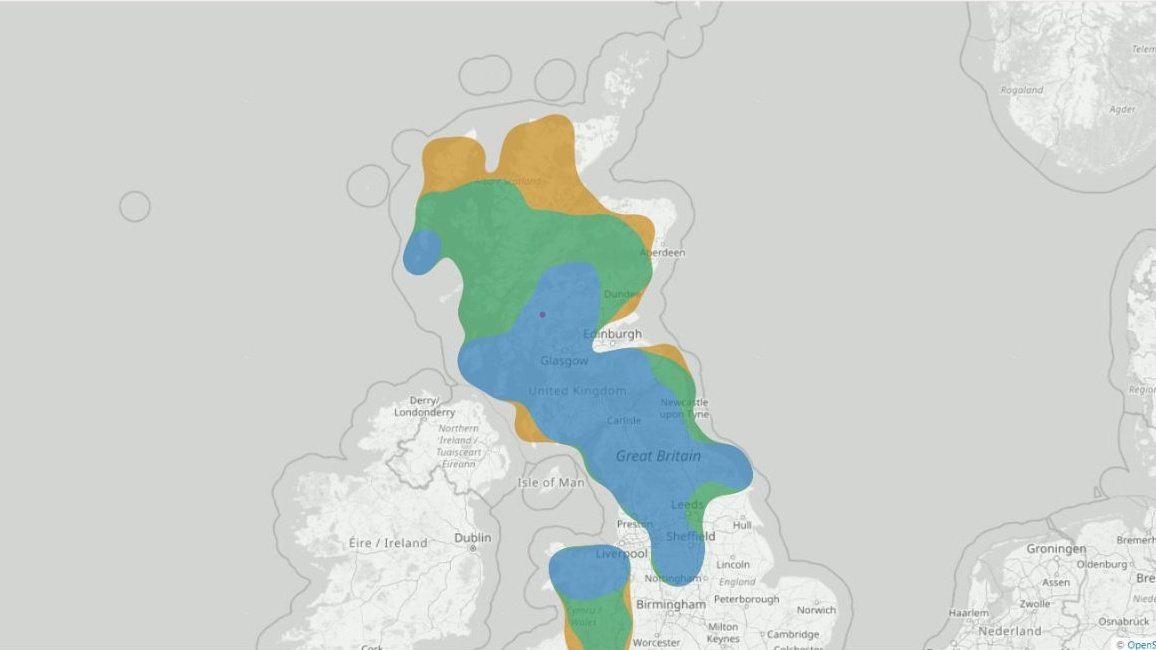
14 October 2025 · Very likely direct match · observation confidence 10/10
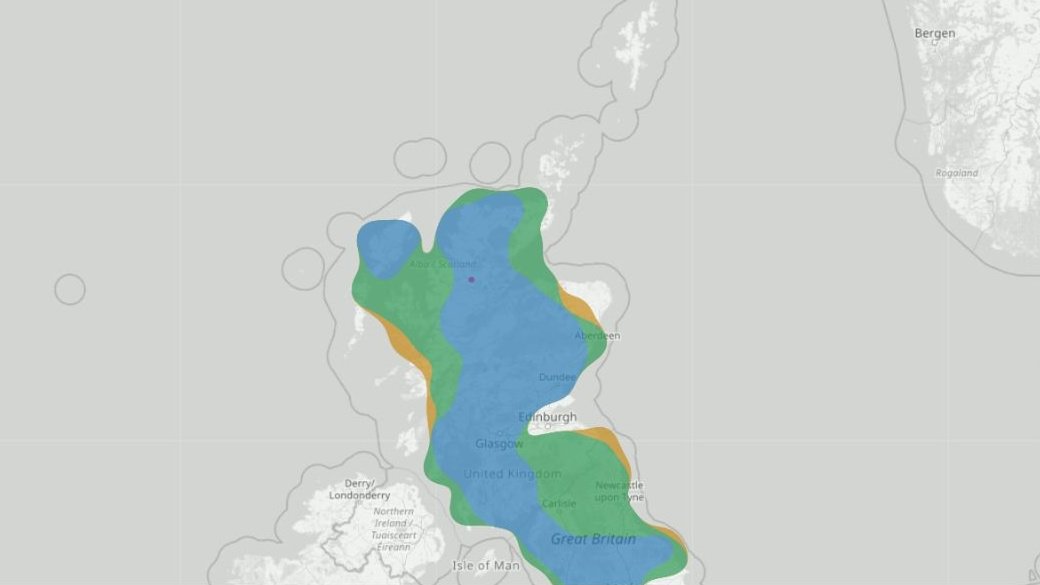
13 October 2025 · Very likely direct match · observation confidence 10/10
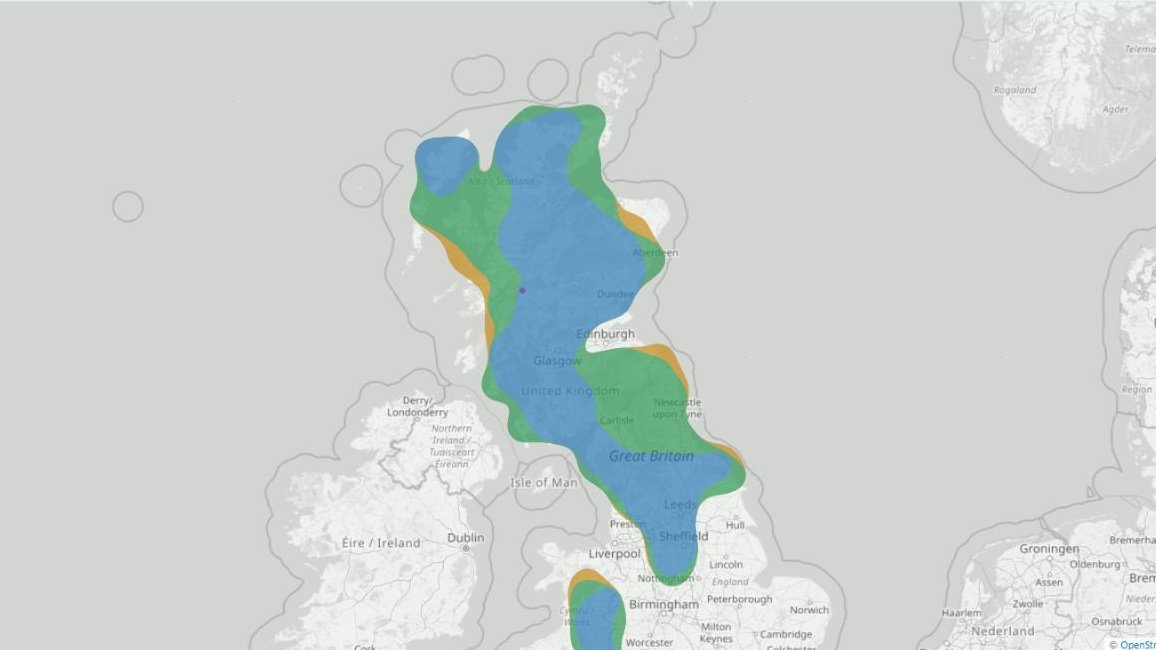
13 October 2025 · Very likely direct match · observation confidence 10/10
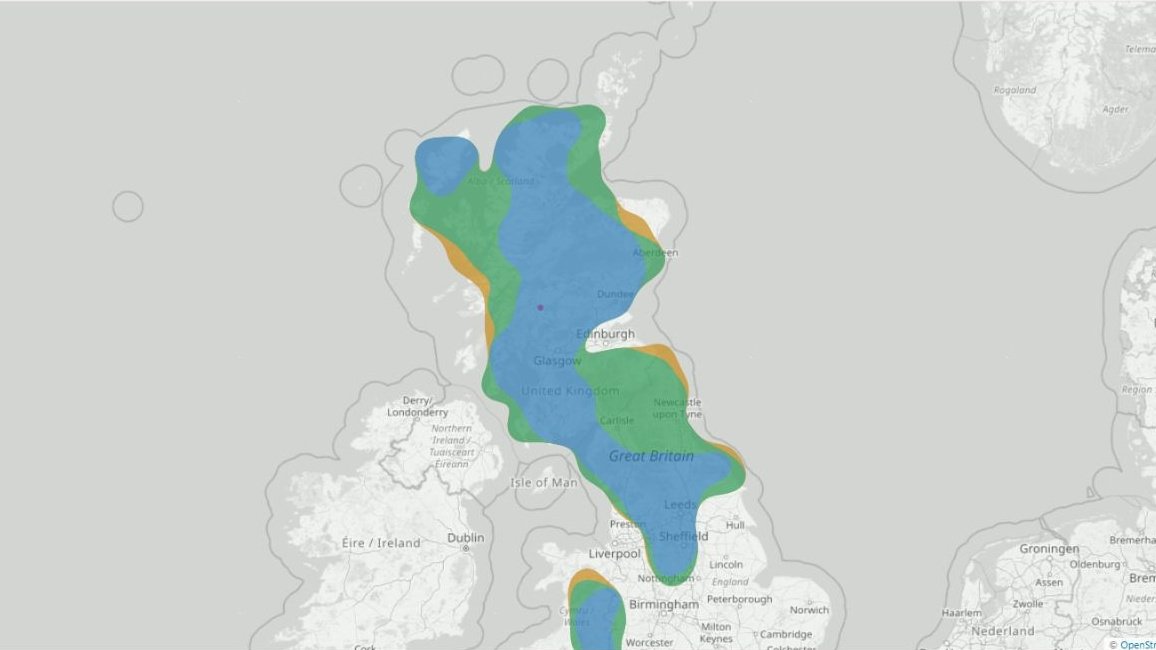
13 October 2025 · Very likely direct match · observation confidence 9/10
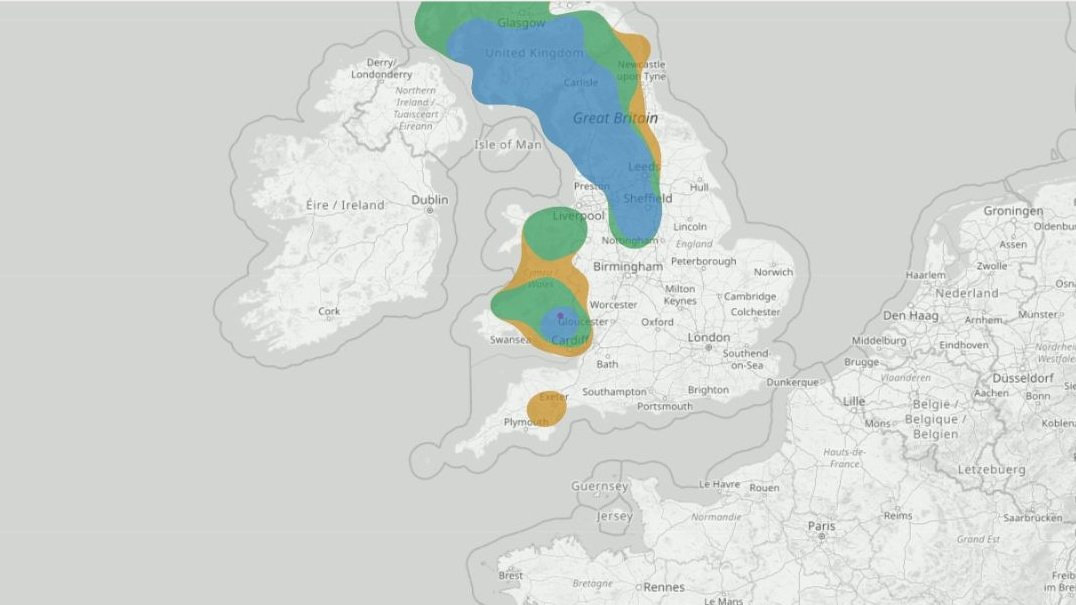
12 October 2025 · Very likely direct match · observation confidence 8/10
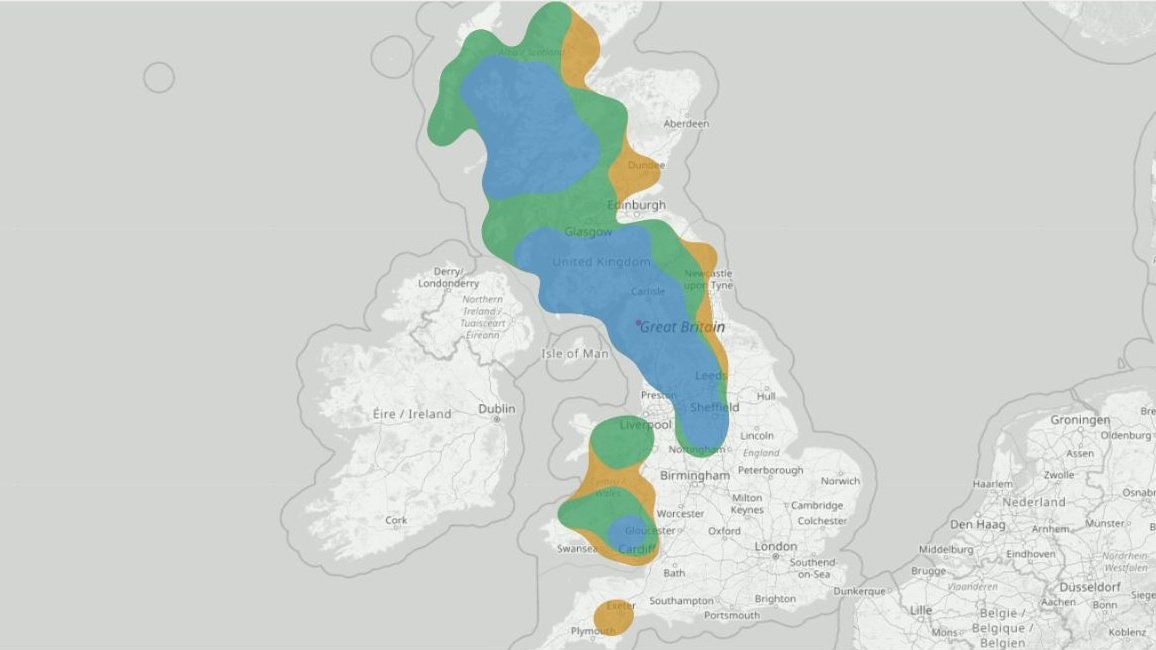
12 October 2025 · Very likely direct match · observation confidence 10/10
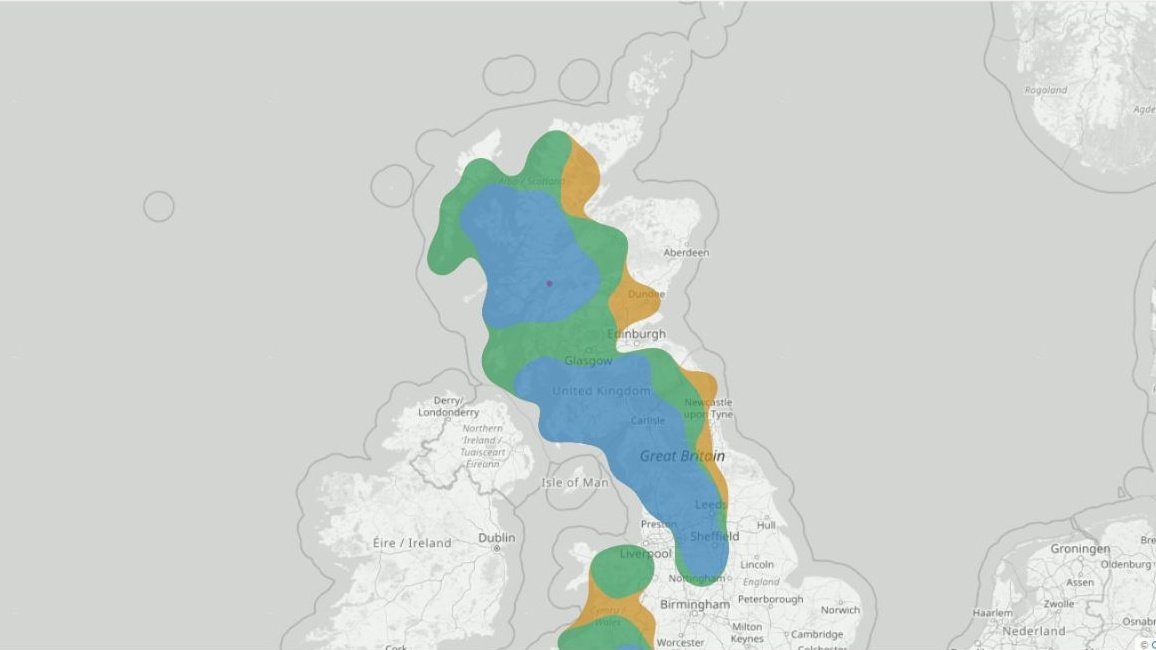
12 October 2025 · Very likely direct match · observation confidence 9/10
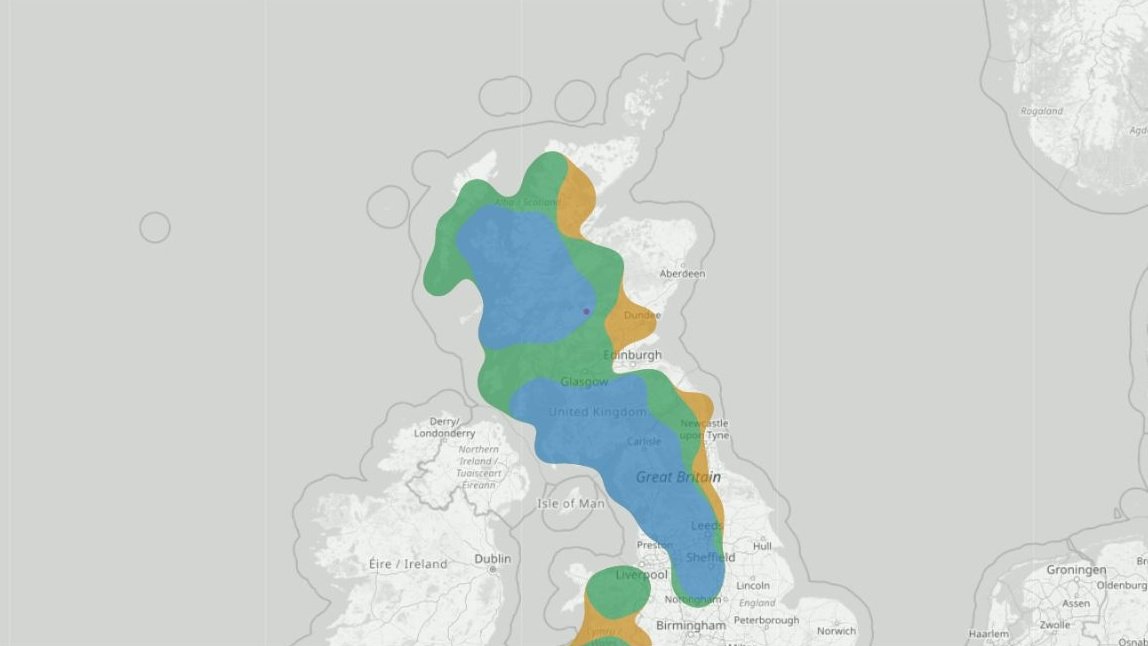
12 October 2025 · Very likely direct match · observation confidence 9/10
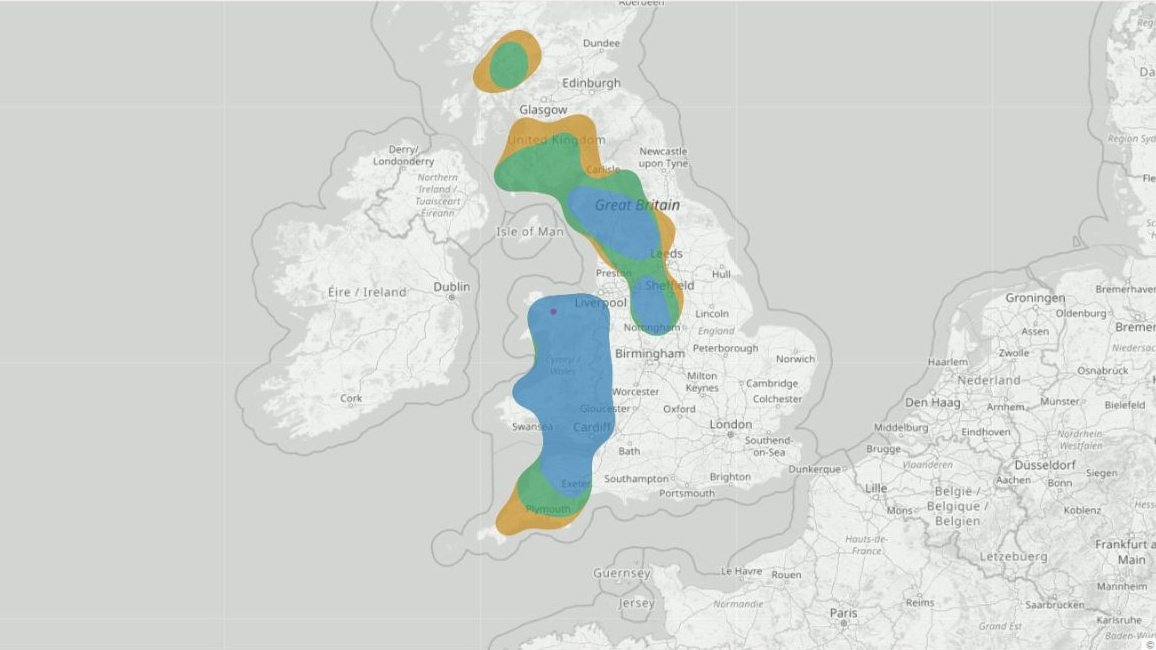
11 October 2025 · Very likely direct match · observation confidence 10/10
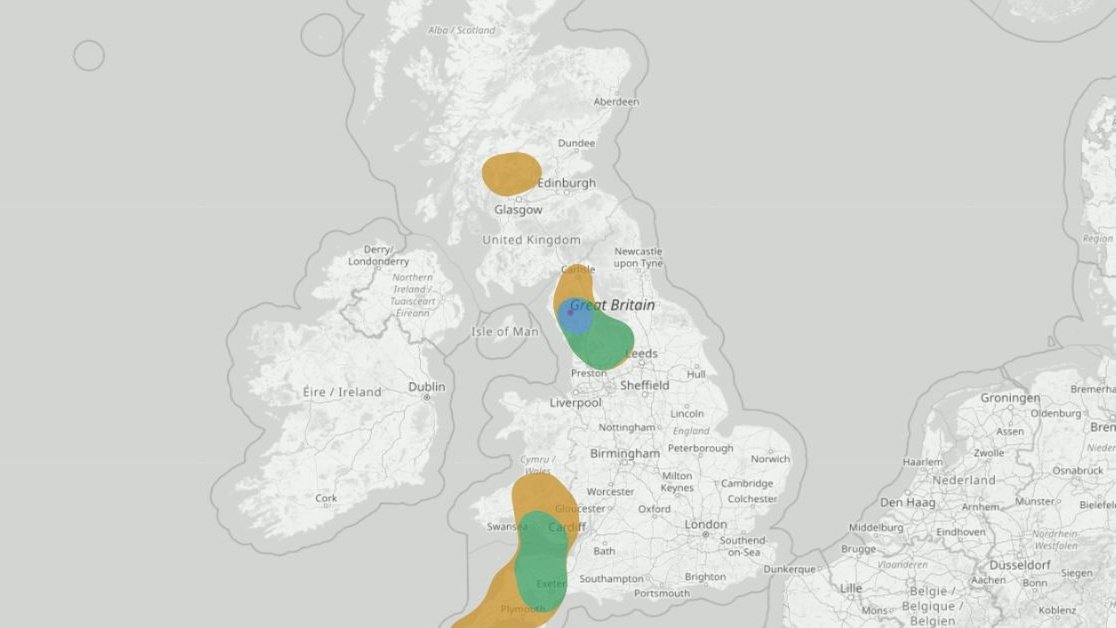
15 January 2025 · Very likely direct match · observation confidence 8/10
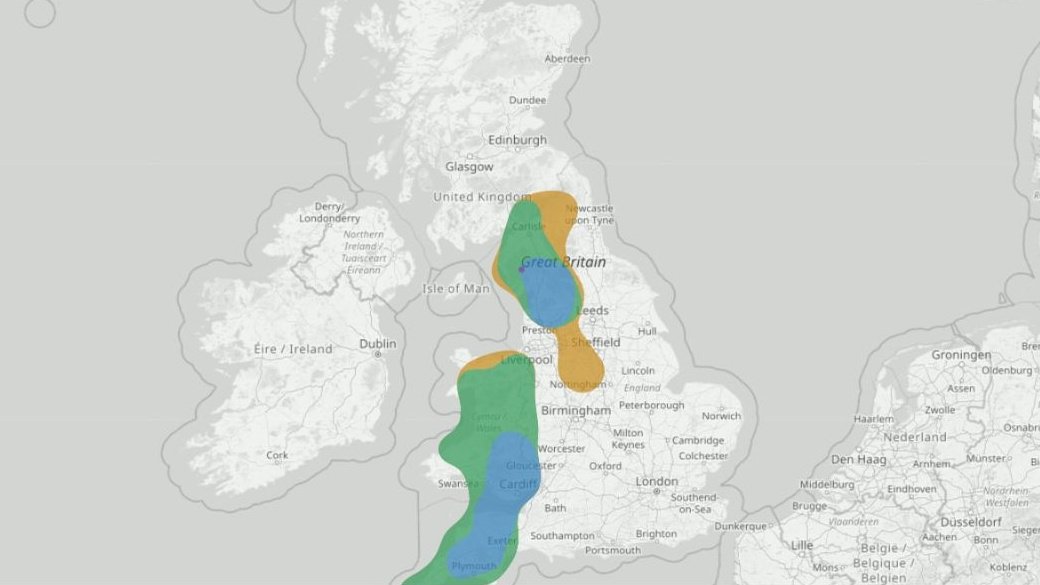
27 December 2024 · Very likely direct match · observation confidence 9/10
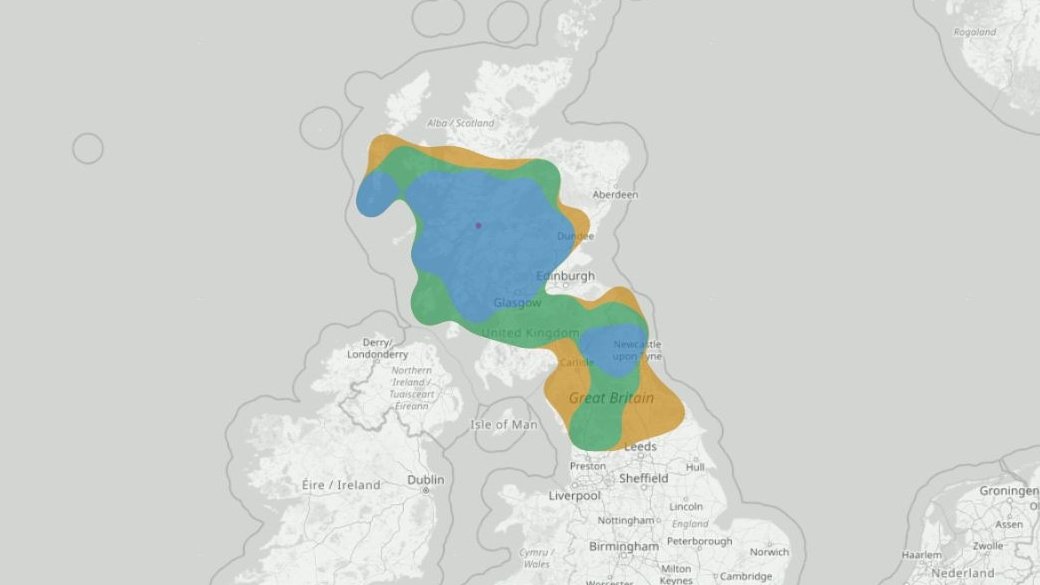
11 December 2024 · Very likely direct match · observation confidence 10/10
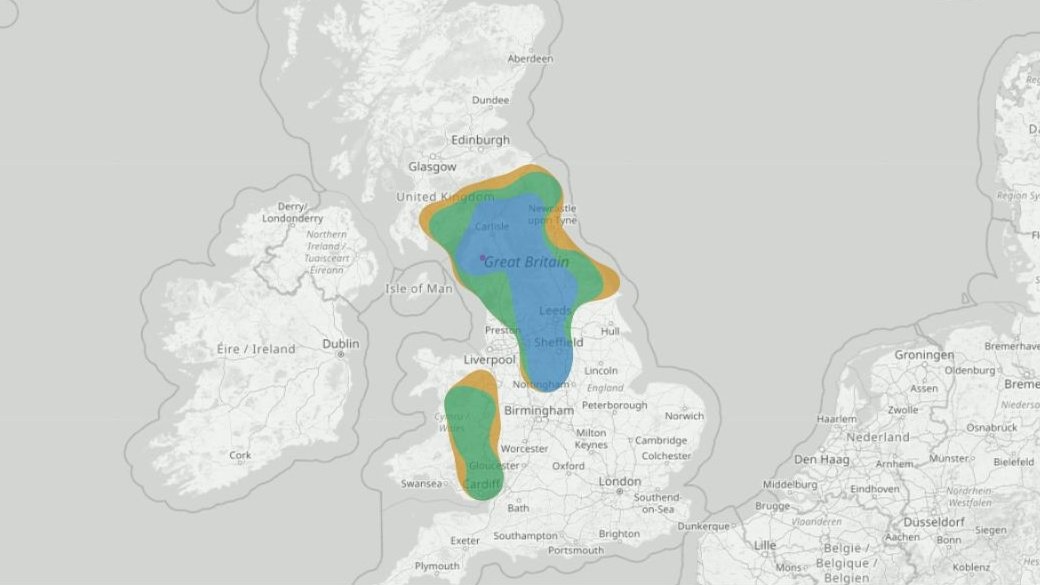
5 November 2024 · Very likely direct match · observation confidence 6/10
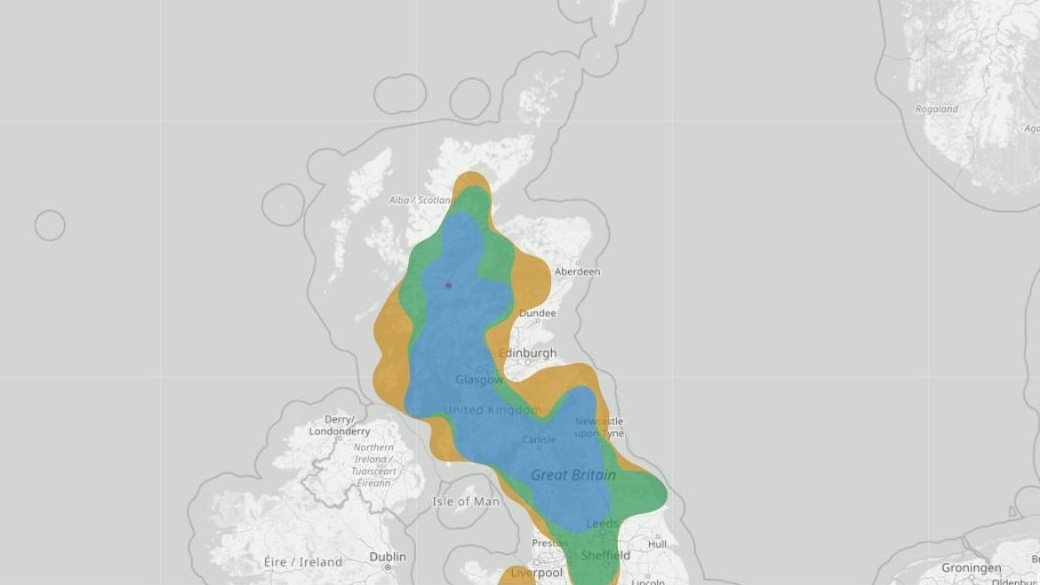
3 November 2024 · Very likely direct match · observation confidence 10/10
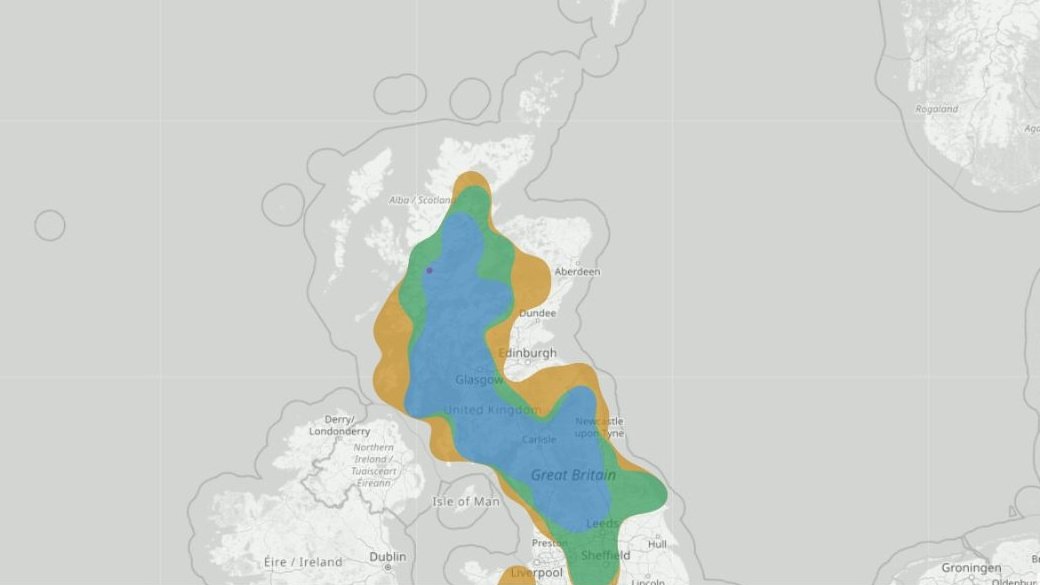
3 November 2024 · Very likely direct match · observation confidence 10/10
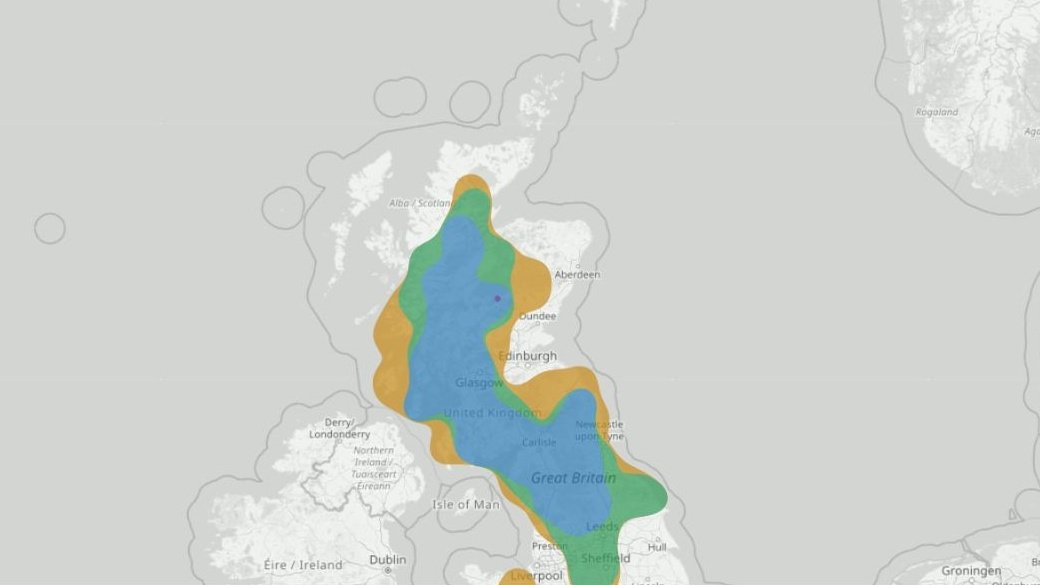
3 November 2024 · Very likely direct match · observation confidence 7/10
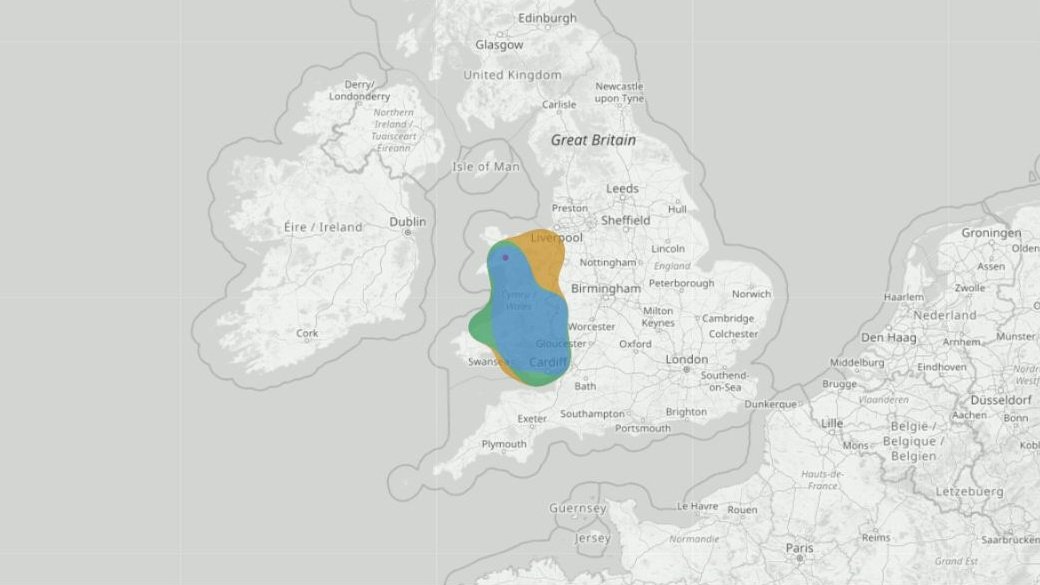
31 October 2024 · Very likely direct match · observation confidence 9/10
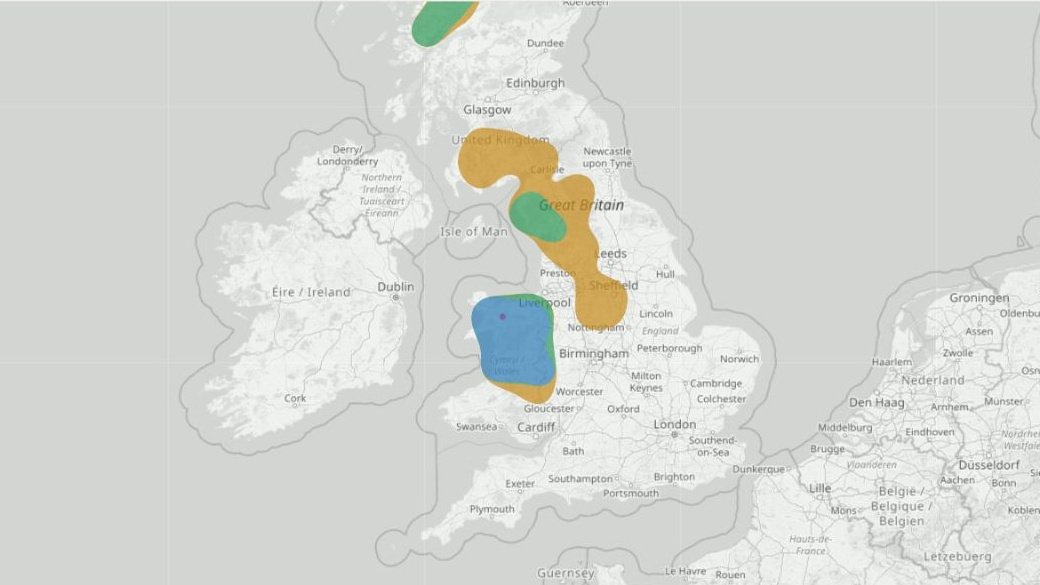
30 October 2024 · Very likely direct match · observation confidence 9/10
REPLAY GROUP · 17 EVENTS
17 events where the observation point sits inside a Likely production-geometry blob.
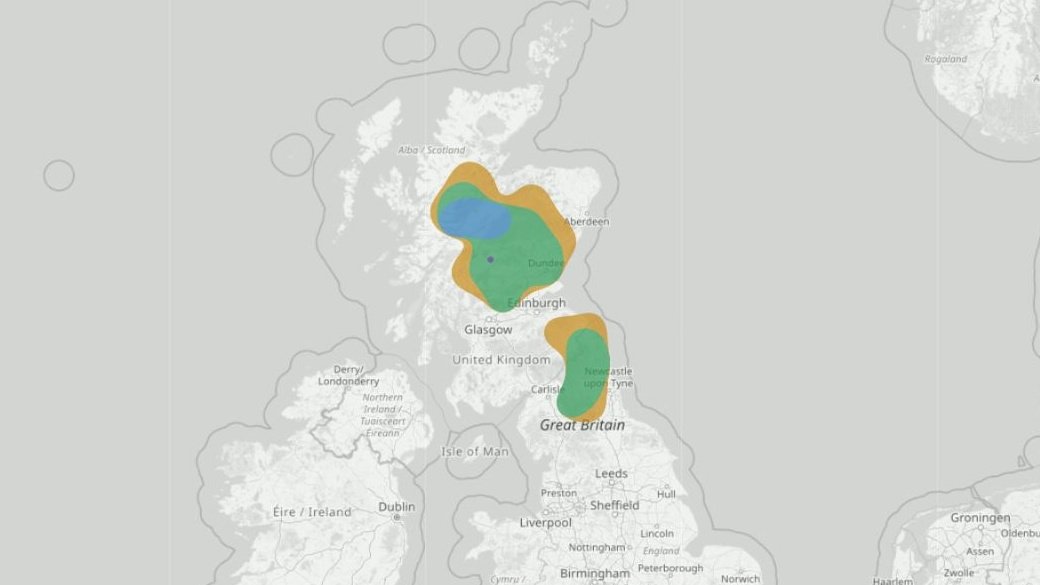
27 December 2025 · Likely direct match · observation confidence 10/10
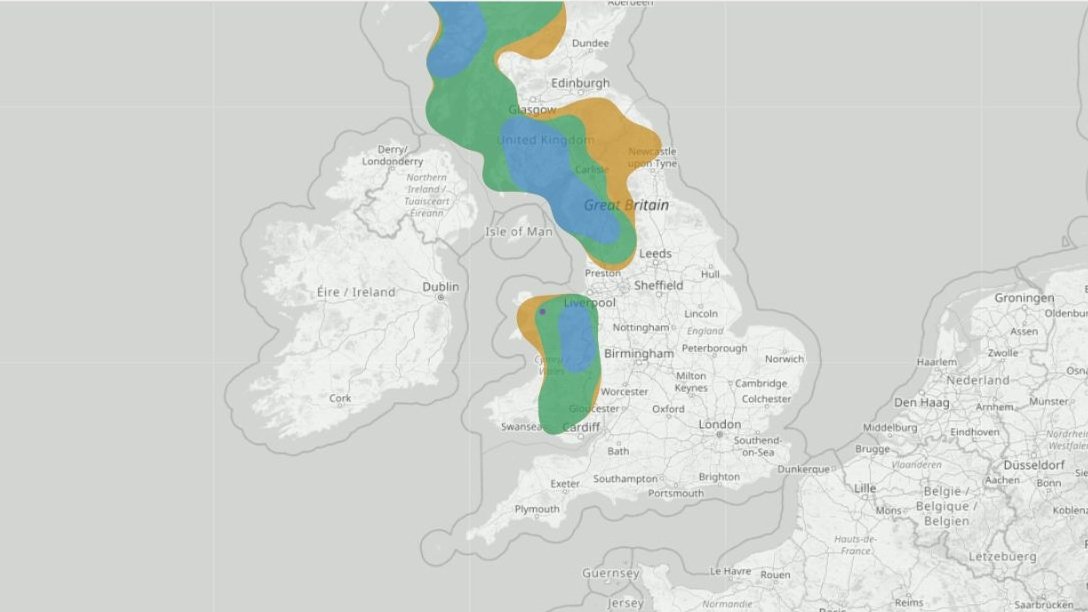
16 October 2025 · Likely direct match · observation confidence 10/10
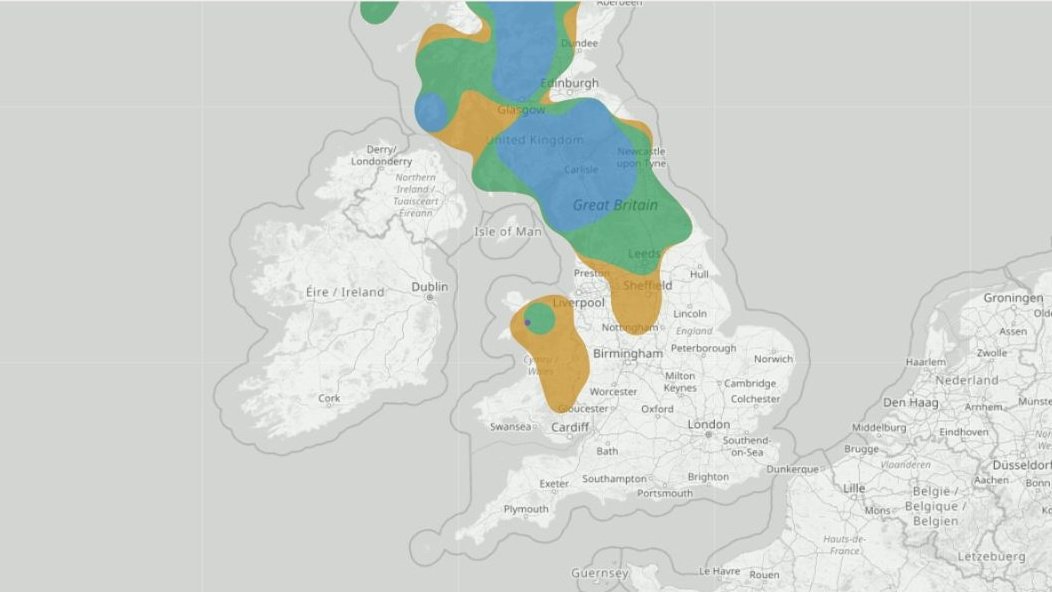
15 October 2025 · Likely direct match · observation confidence 10/10
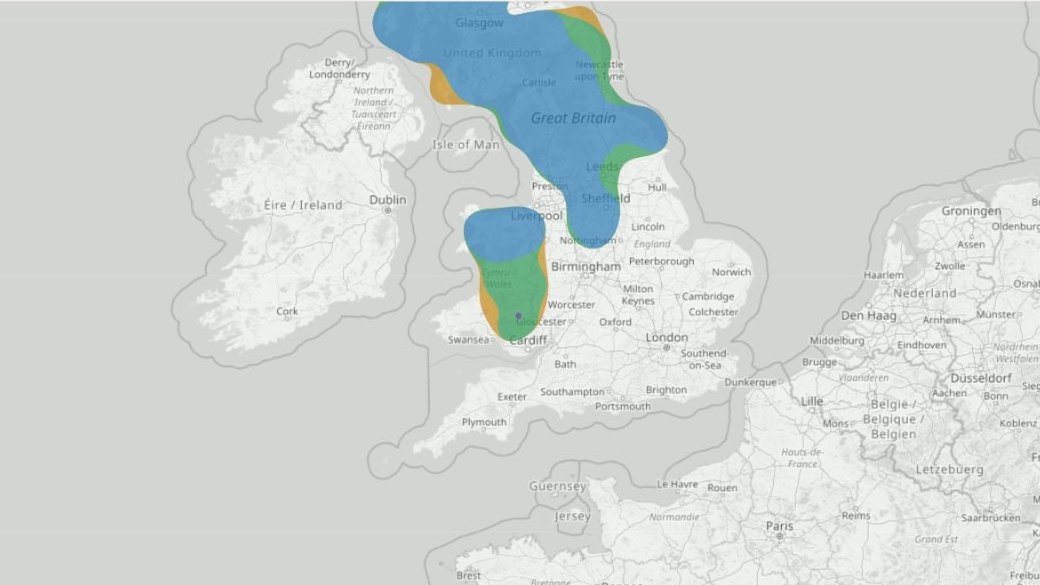
14 October 2025 · Likely direct match · observation confidence 8/10
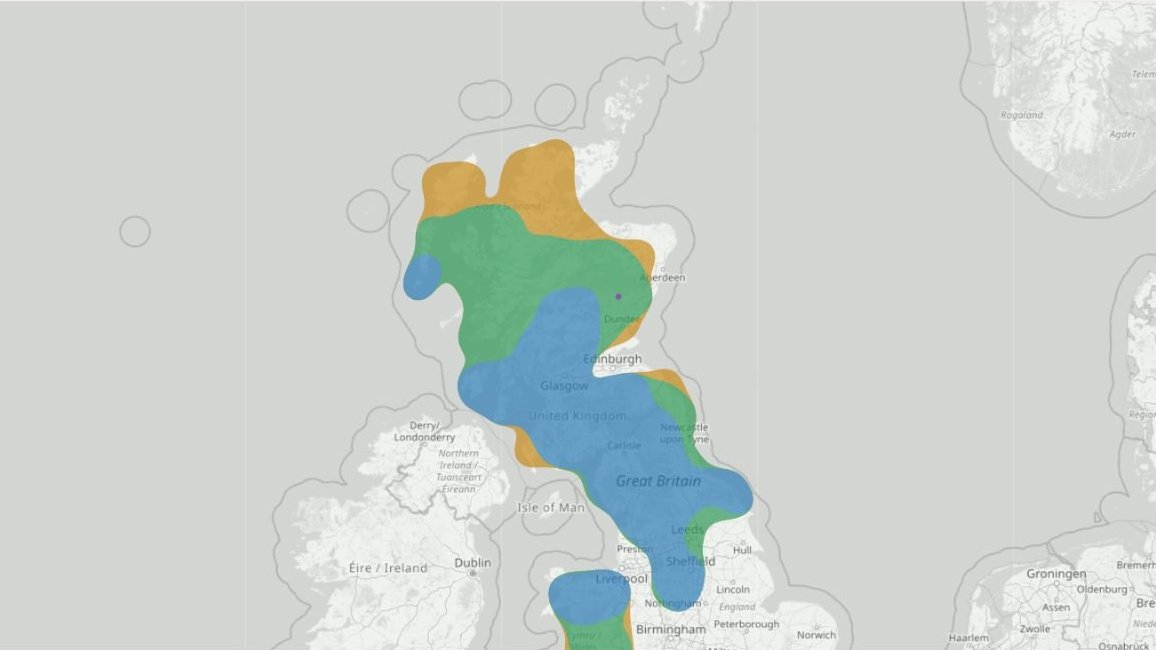
14 October 2025 · Likely direct match · observation confidence 9/10
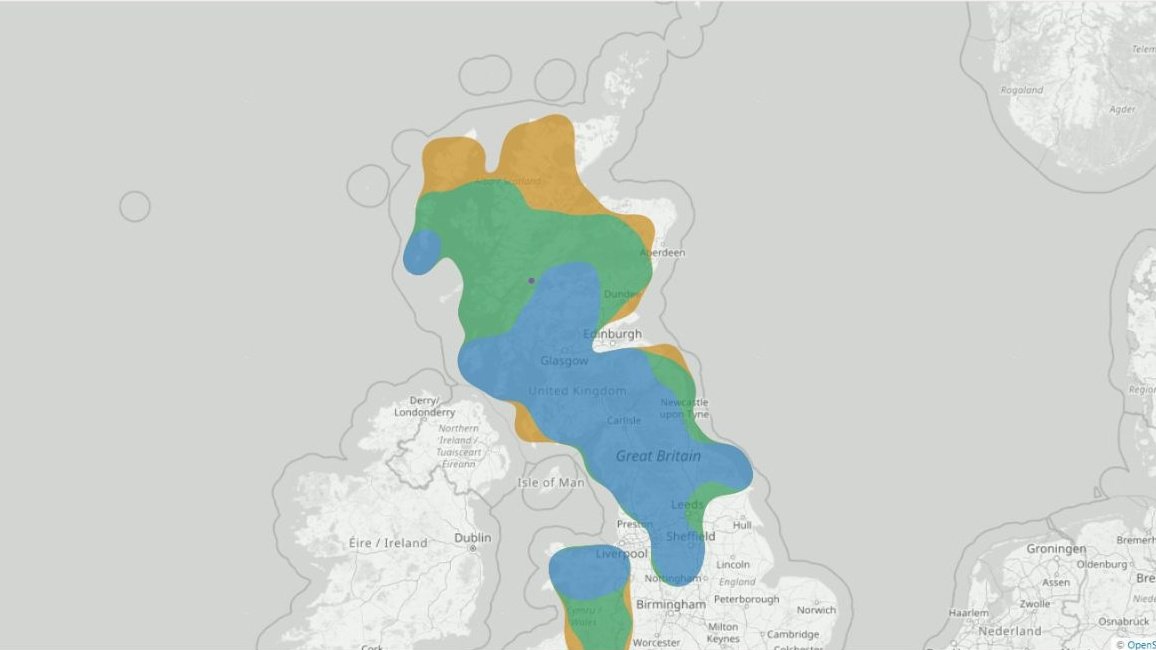
14 October 2025 · Likely direct match · observation confidence 10/10
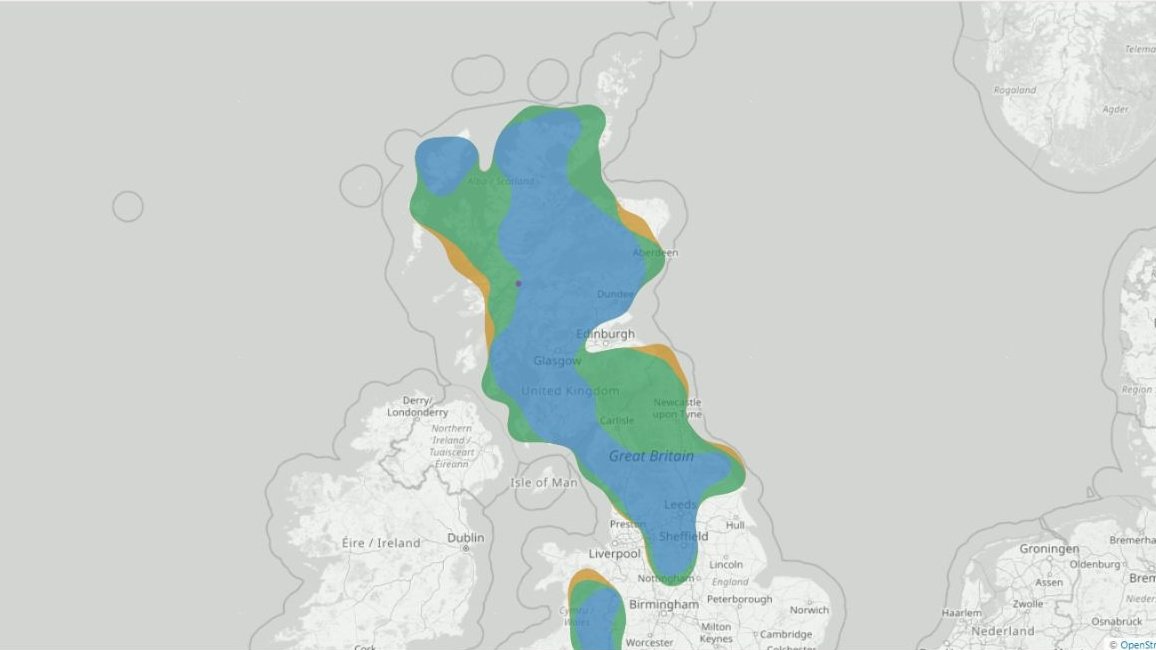
13 October 2025 · Likely direct match · observation confidence 10/10
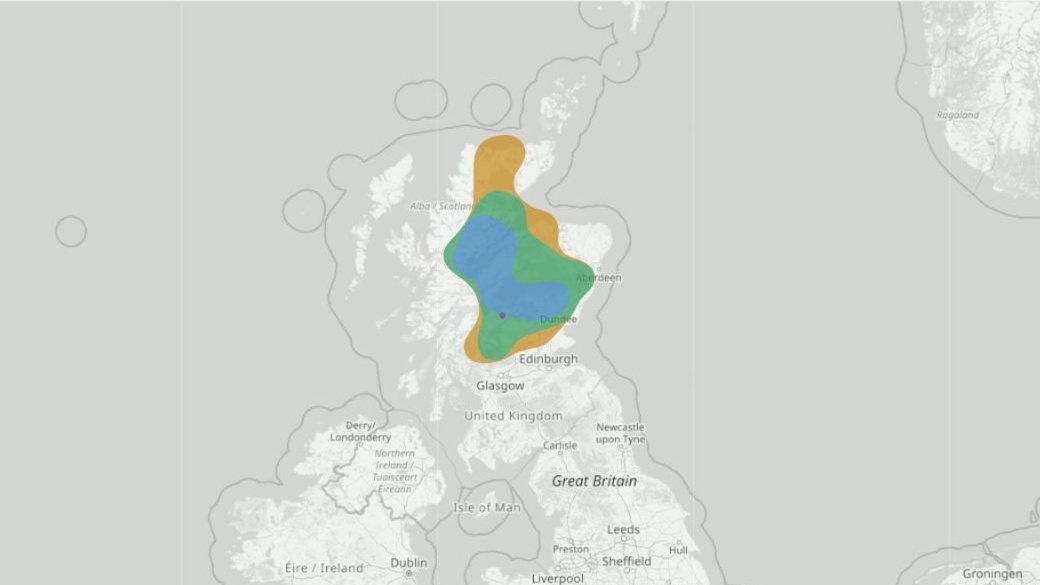
19 August 2025 · Likely direct match · observation confidence 10/10
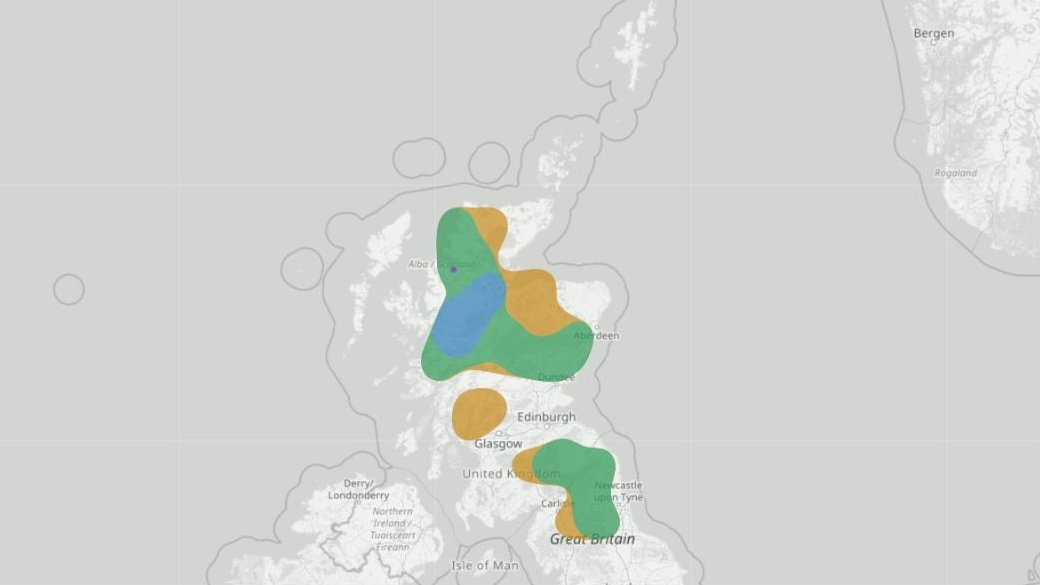
16 August 2025 · Likely direct match · observation confidence 7/10
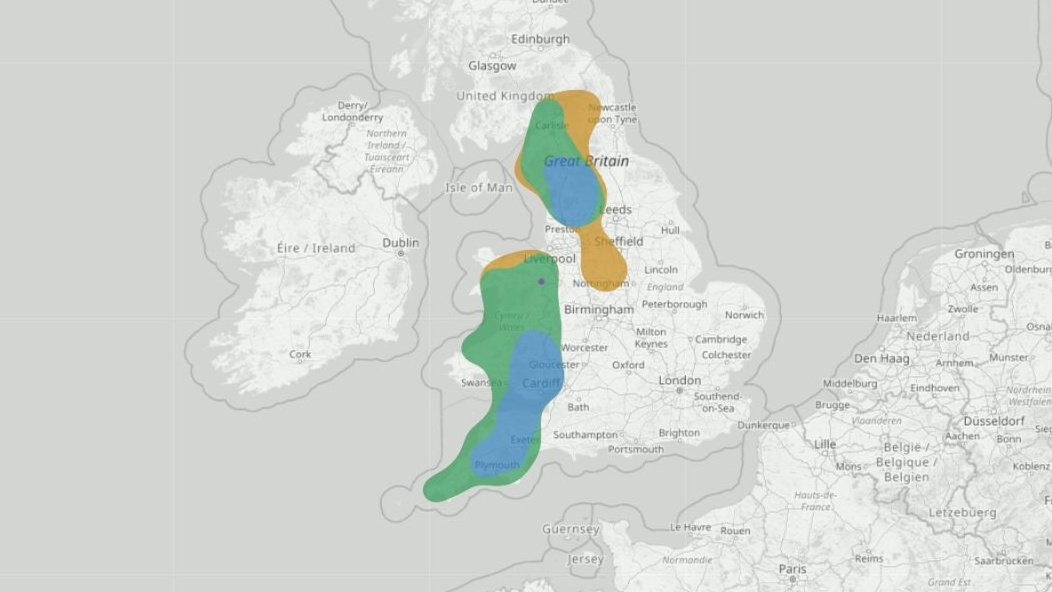
27 December 2024 · Likely direct match · observation confidence 5/10
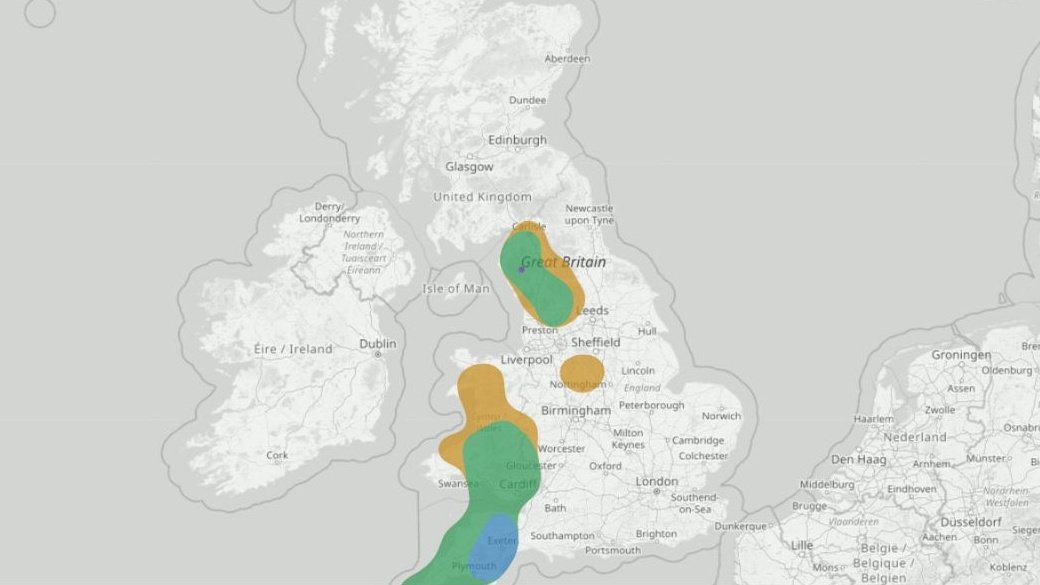
26 December 2024 · Likely direct match · observation confidence 7/10
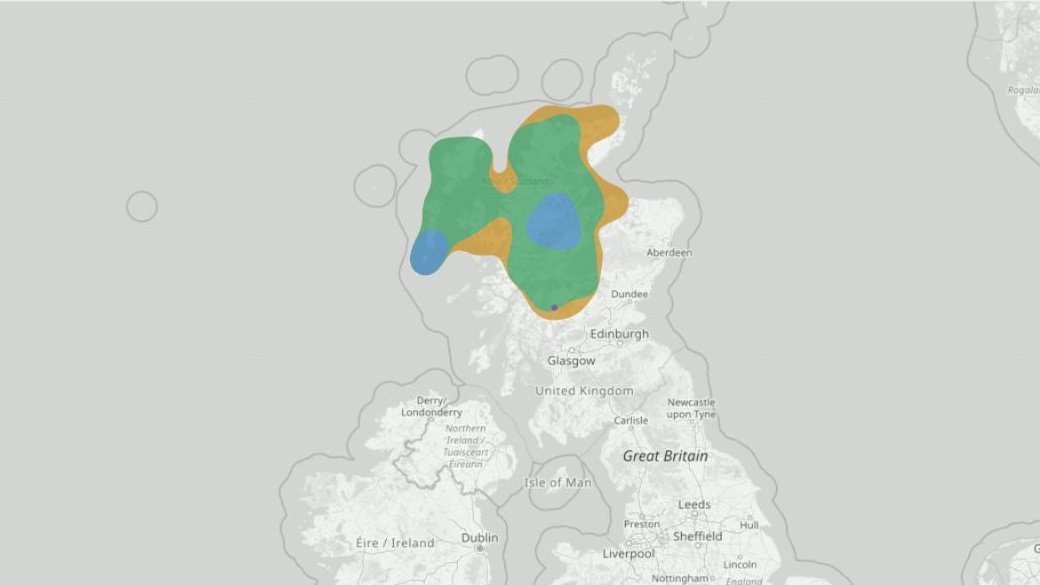
9 December 2024 · Likely direct match · observation confidence 5/10
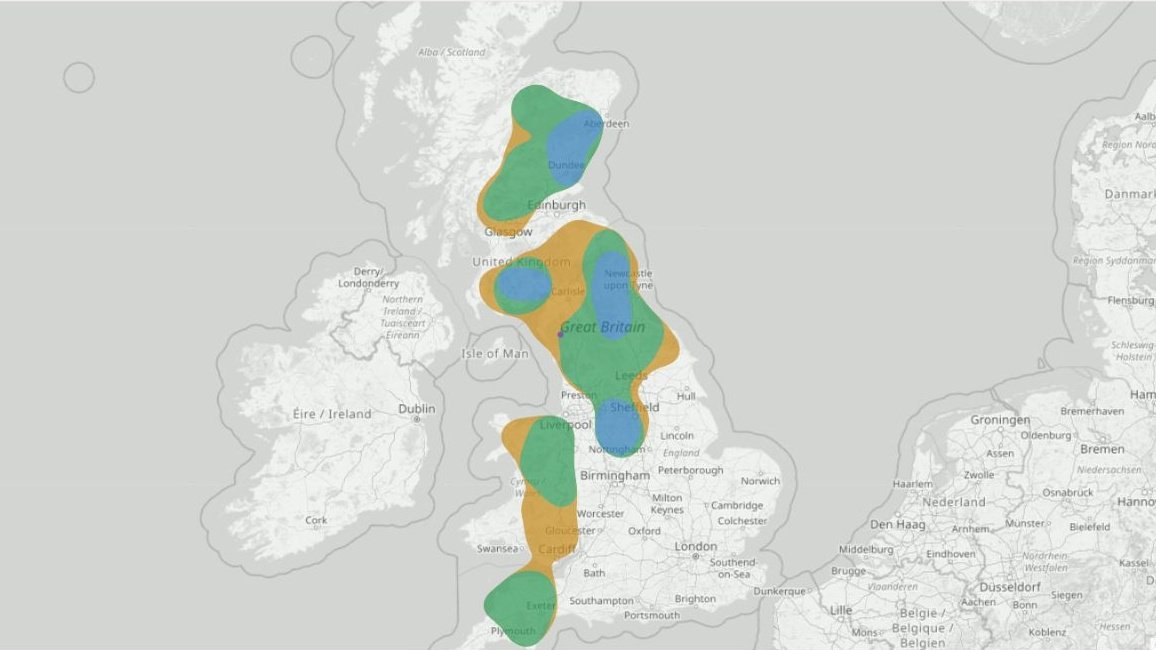
9 November 2024 · Likely direct match · observation confidence 10/10
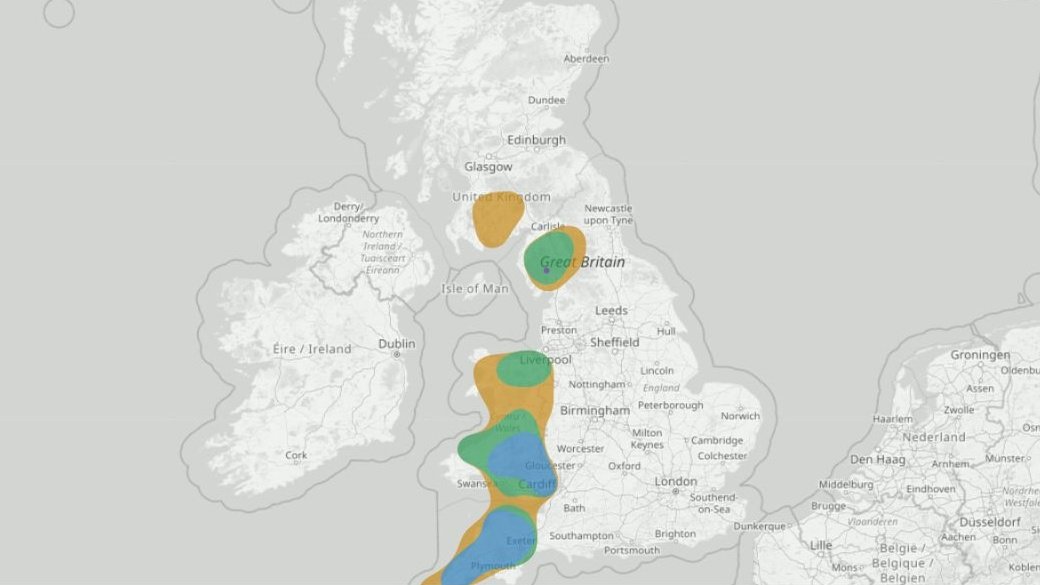
1 November 2024 · Likely direct match · observation confidence 9/10
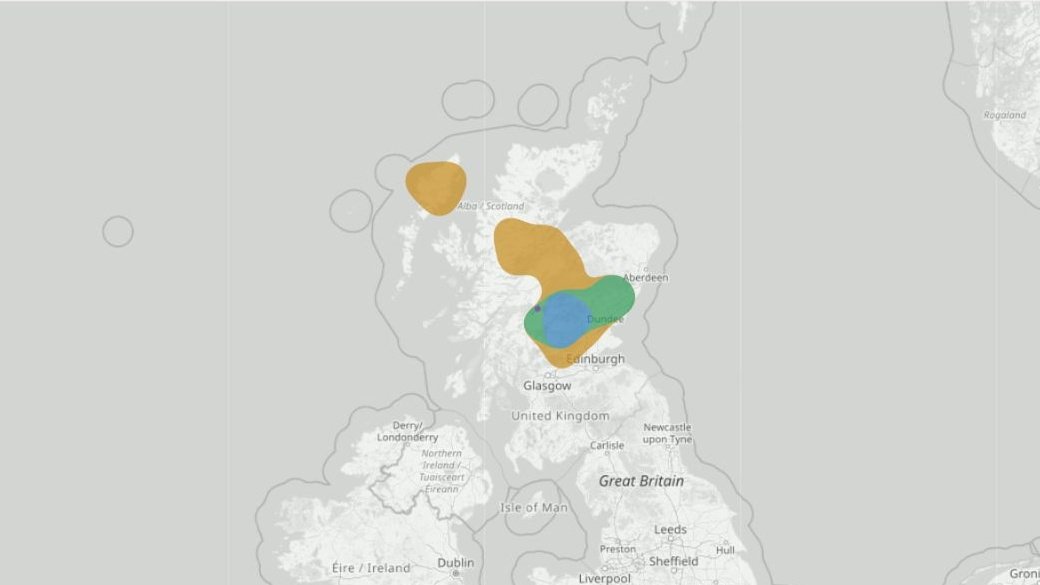
21 September 2024 · Likely direct match · observation confidence 10/10
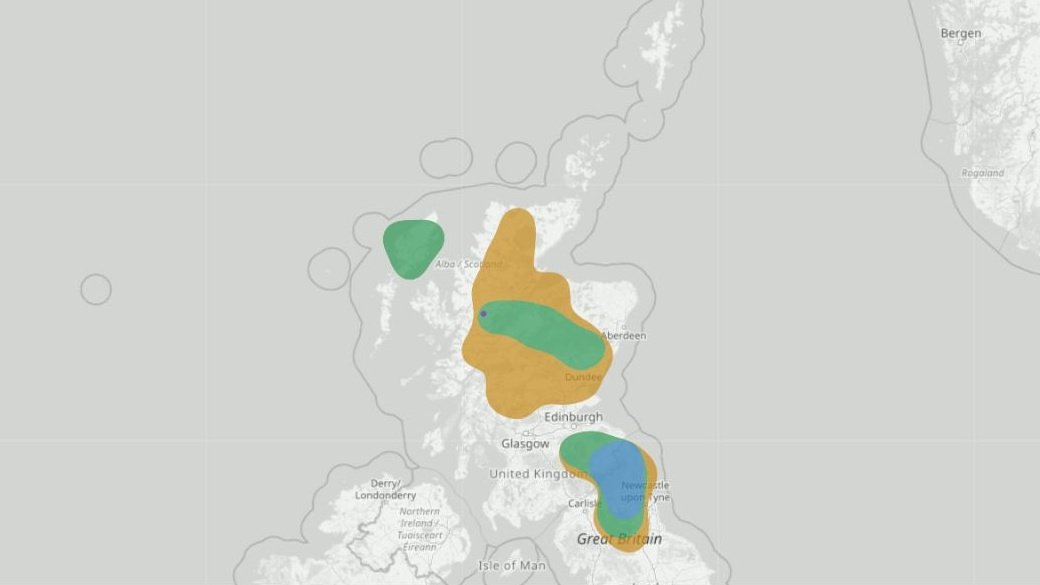
20 September 2024 · Likely direct match · observation confidence 10/10
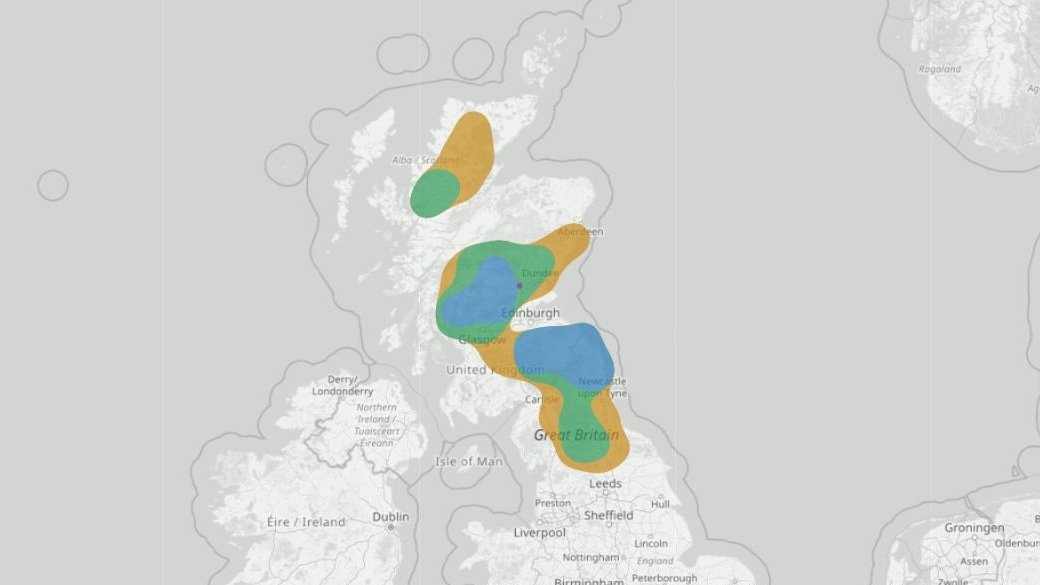
19 September 2024 · Likely direct match · observation confidence 5/10
REPLAY GROUP · 13 EVENTS
13 events where the observation point sits inside a Possible production-geometry blob.
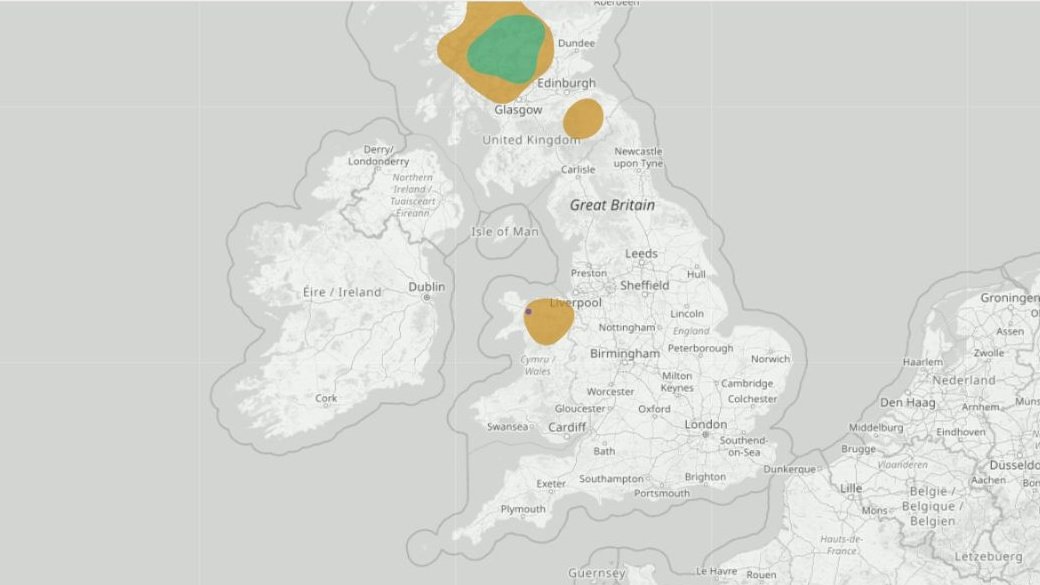
29 December 2025 · Possible direct match · observation confidence 10/10
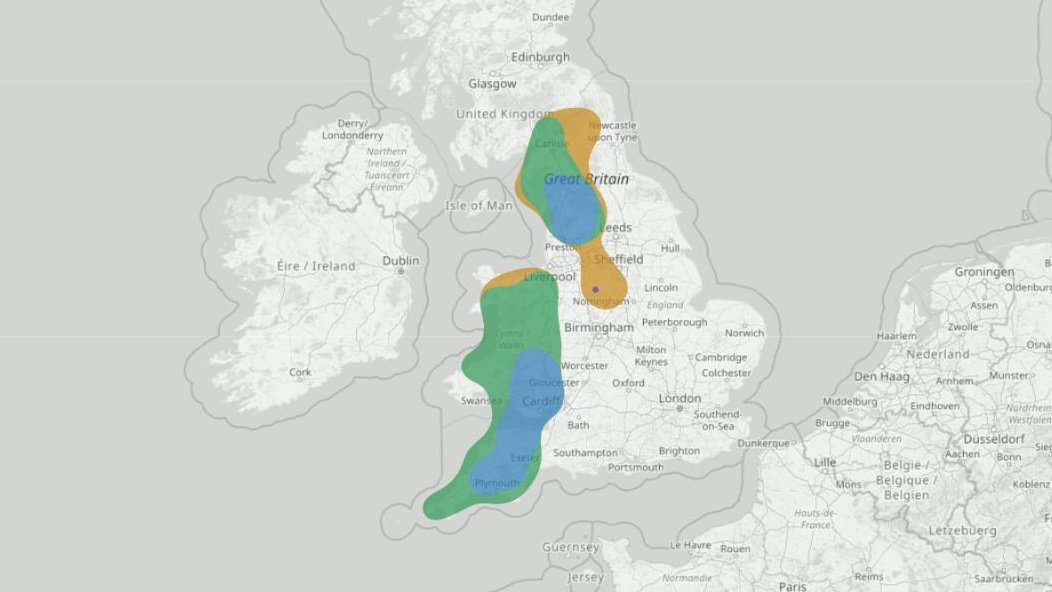
27 December 2024 · Possible direct match · observation confidence 10/10
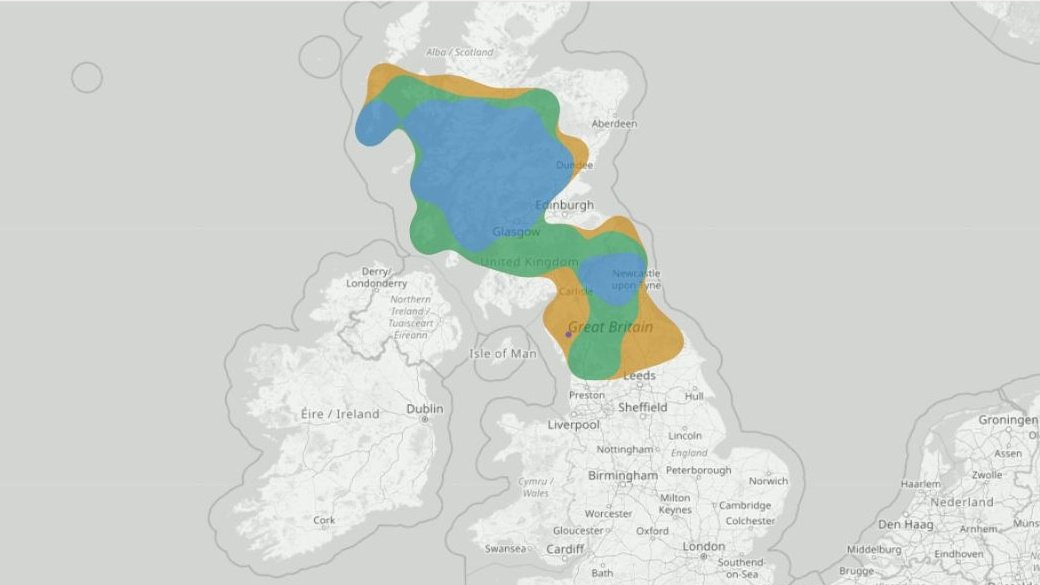
11 December 2024 · Possible direct match · observation confidence 10/10
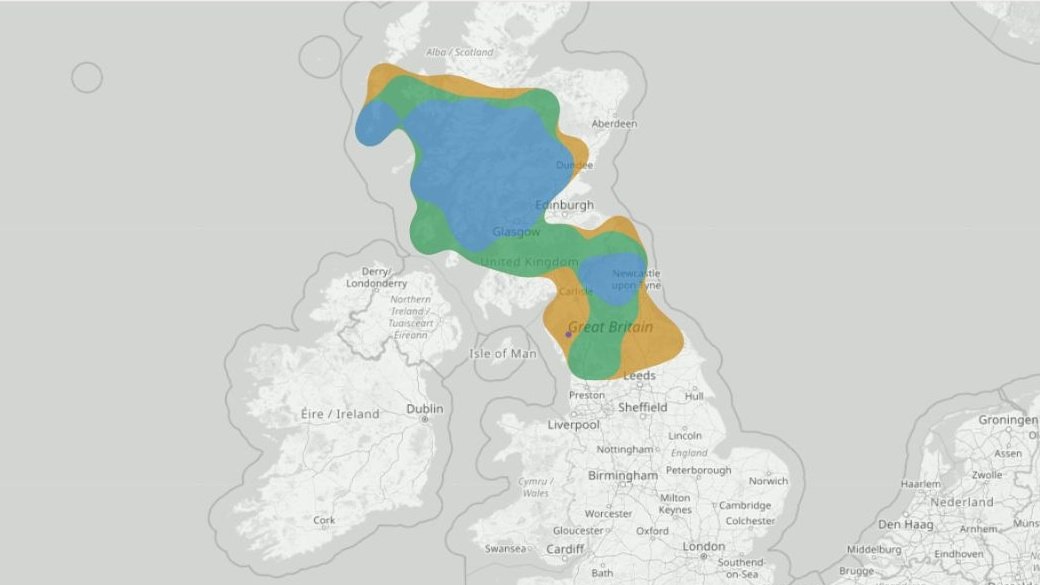
11 December 2024 · Possible direct match · observation confidence 8/10
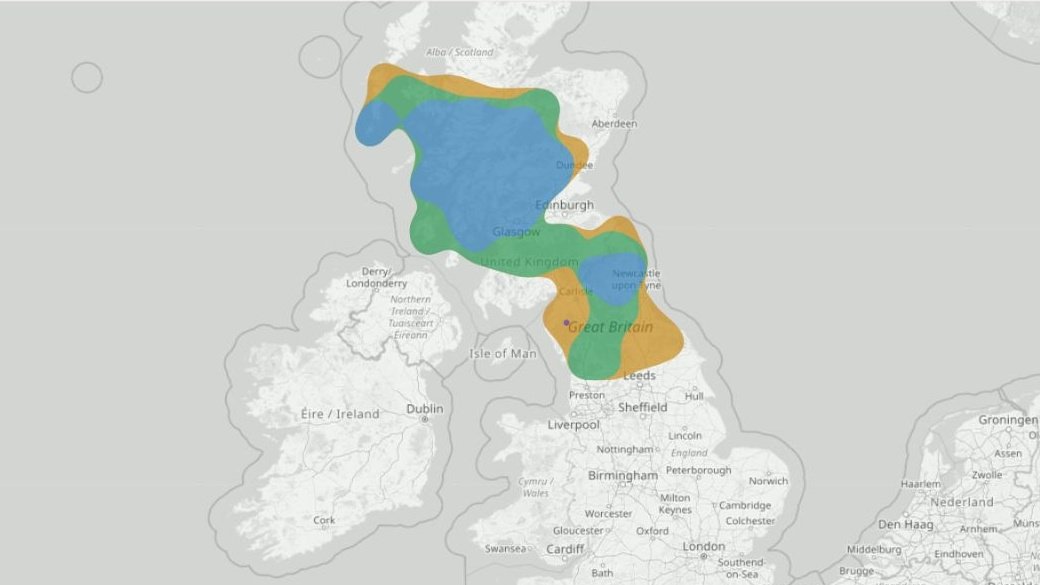
11 December 2024 · Possible direct match · observation confidence 10/10
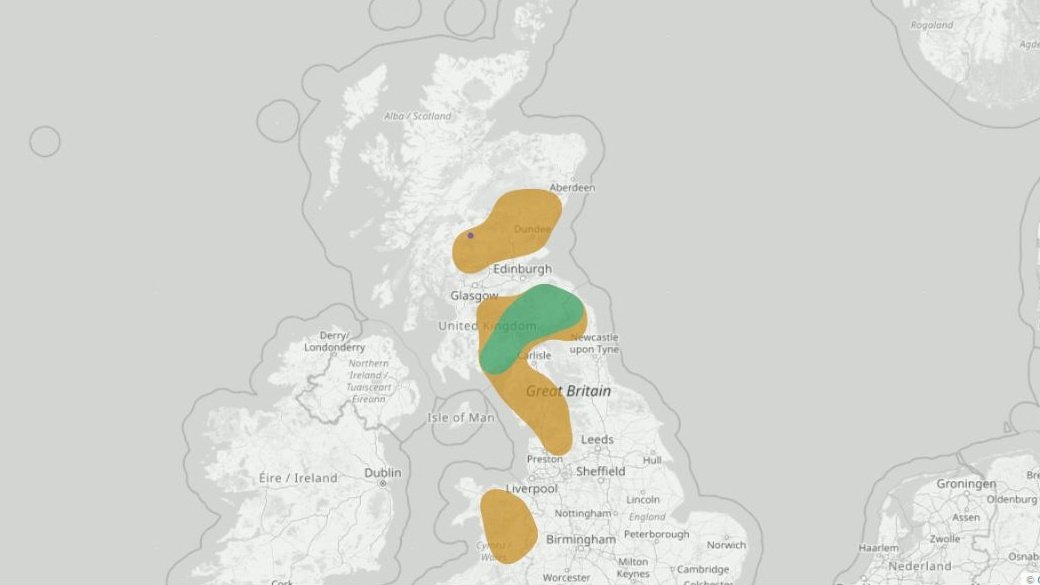
8 November 2024 · Possible direct match · observation confidence 10/10
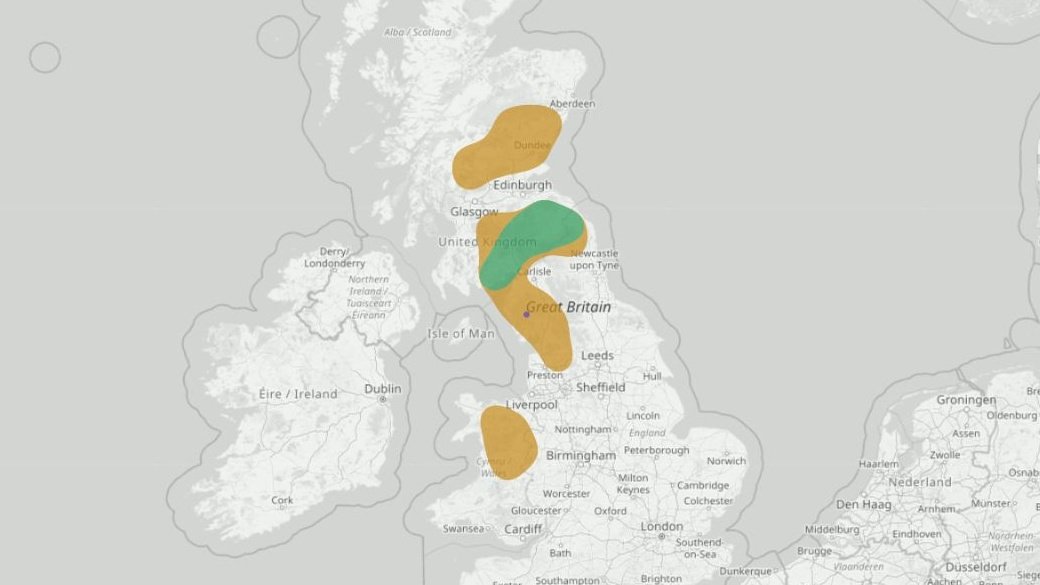
8 November 2024 · Possible direct match · observation confidence 8/10
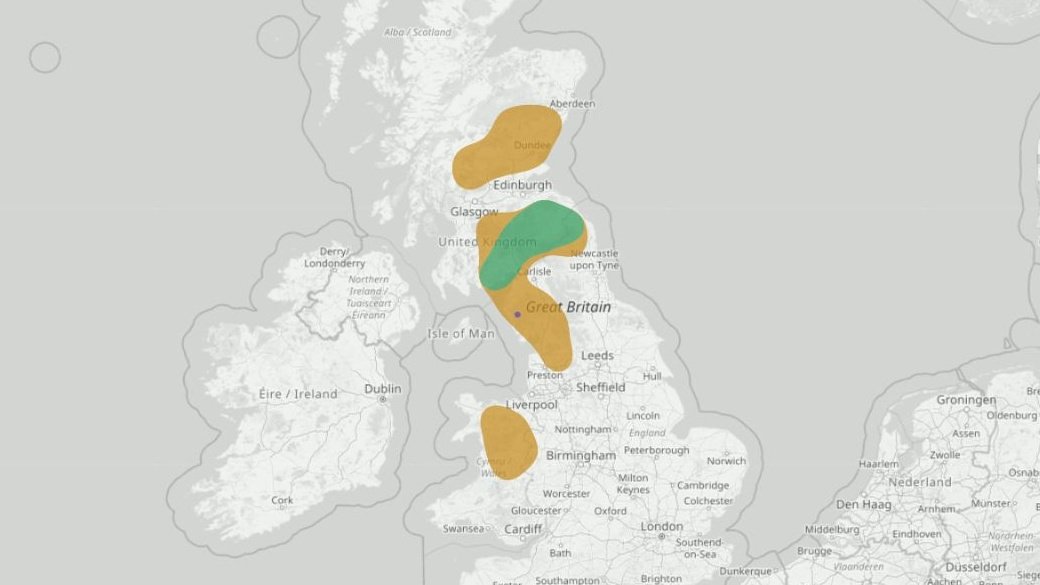
8 November 2024 · Possible direct match · observation confidence 10/10
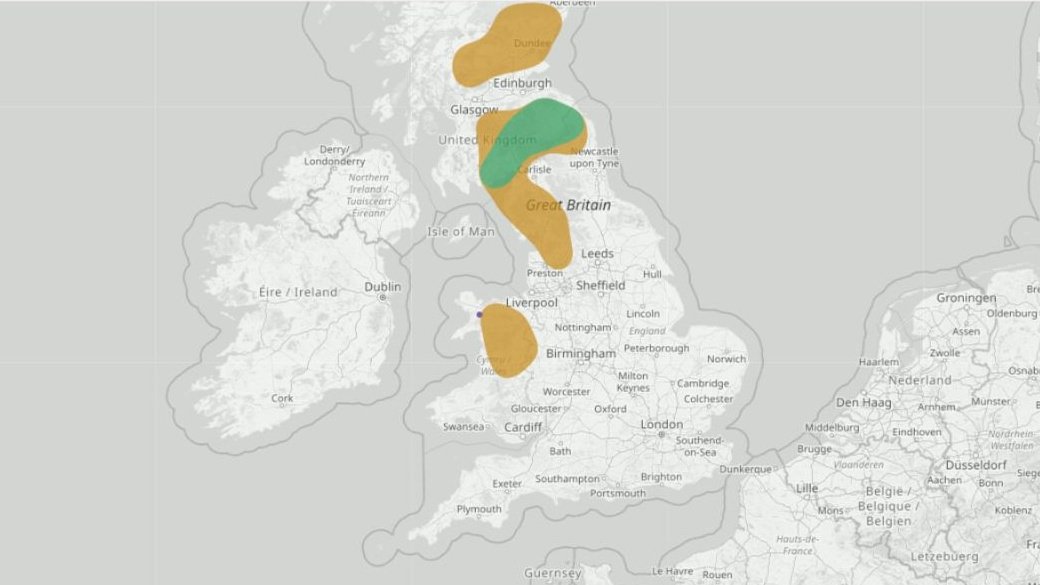
8 November 2024 · Possible direct match · observation confidence 9/10
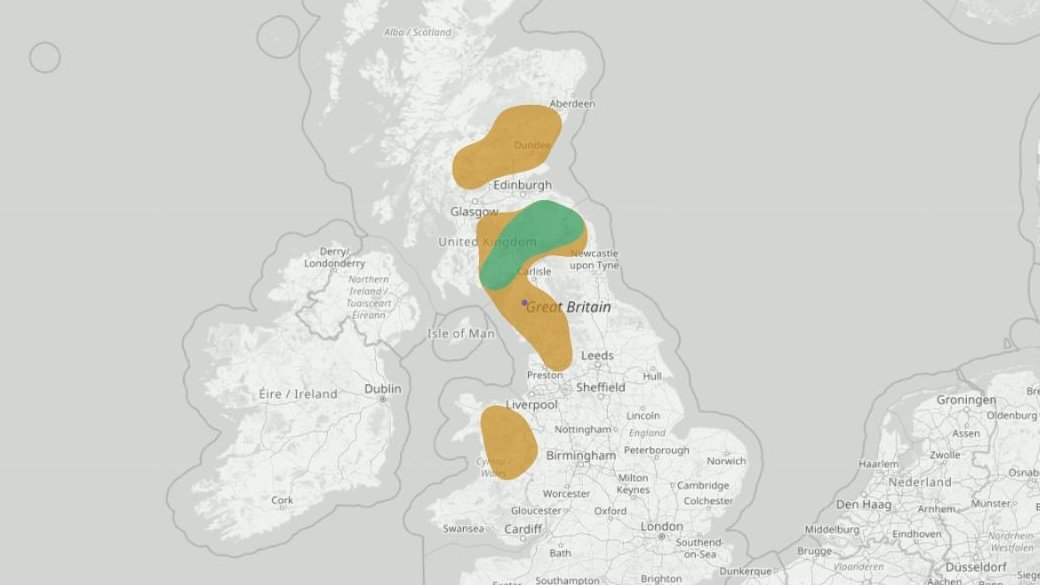
8 November 2024 · Possible direct match · observation confidence 8/10
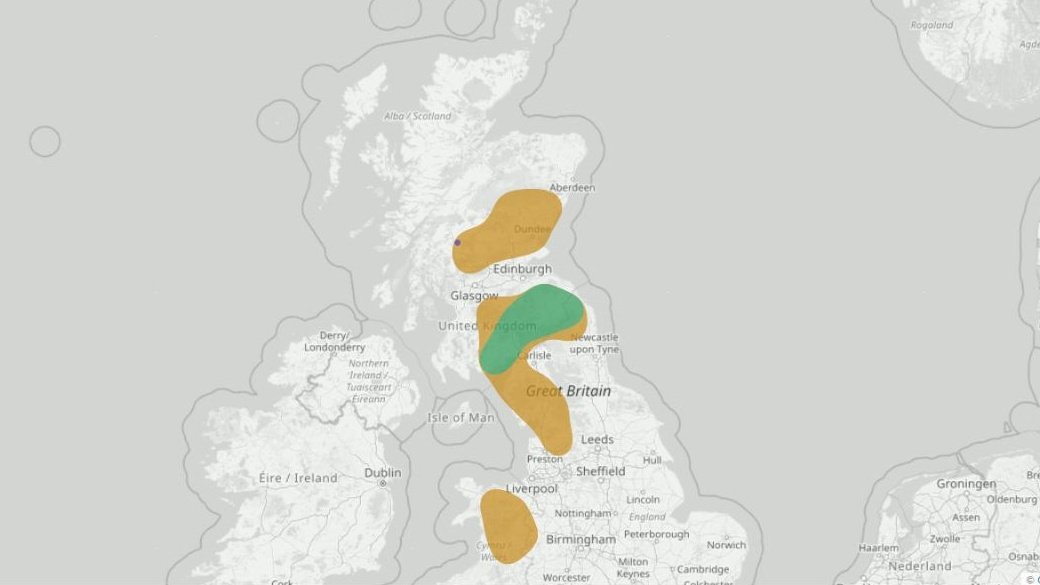
8 November 2024 · Possible direct match · observation confidence 9/10
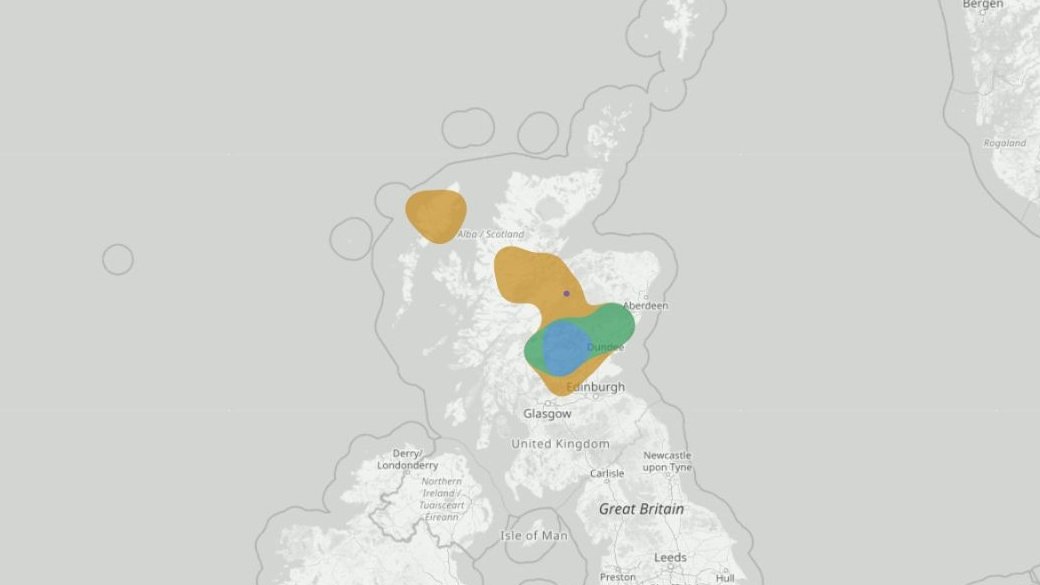
21 September 2024 · Possible direct match · observation confidence 4/10
REPLAY GROUP · 6 EVENTS
6 geographically varied, high-confidence observations where today's production geometry does not place a blob over the observation point. They remain visible because misses and limitations belong in an honest evidence record.
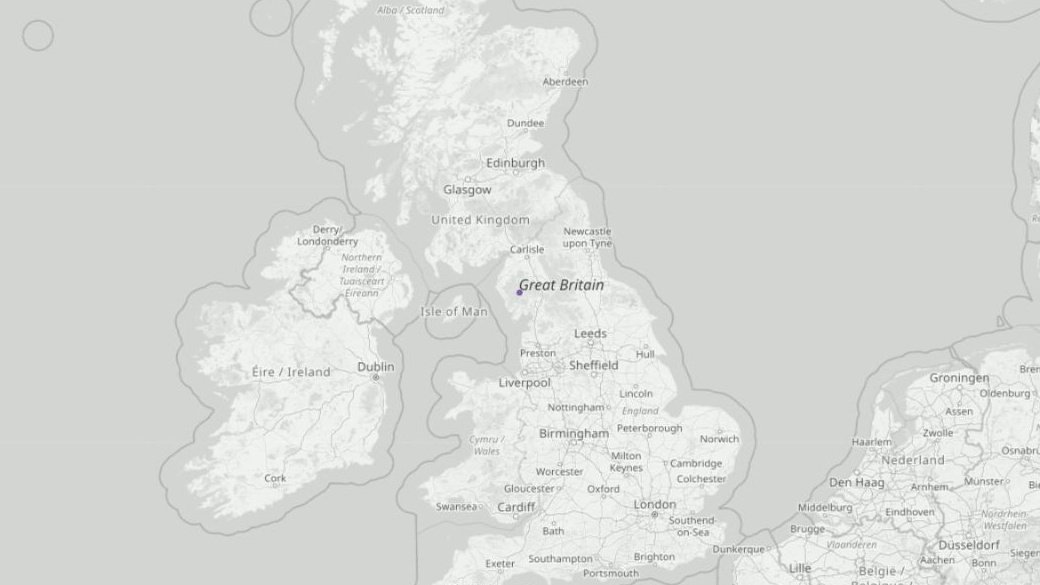
8 January 2026 · No direct match · observation confidence 10/10
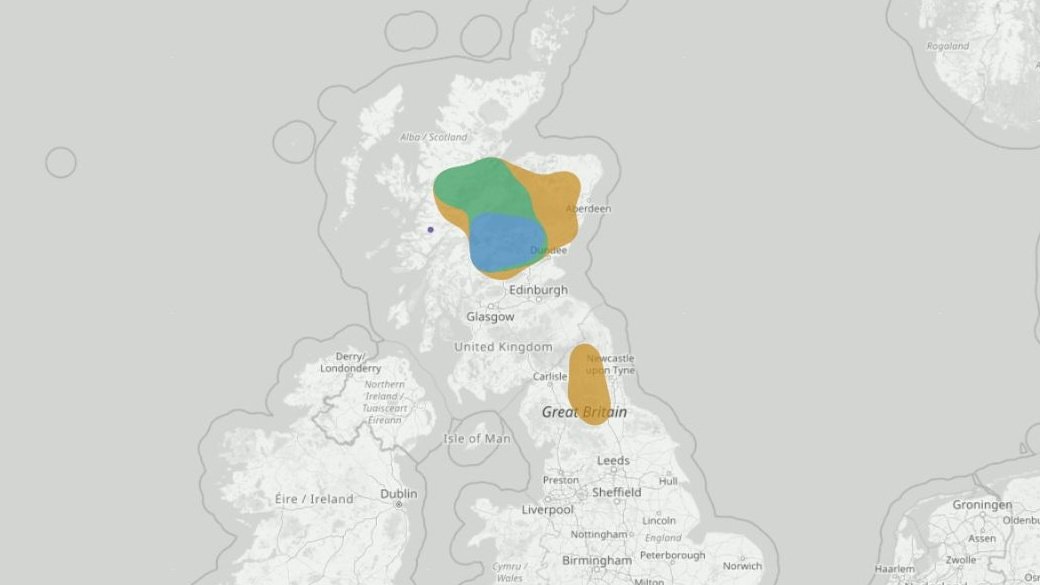
14 May 2025 · No direct match · observation confidence 10/10
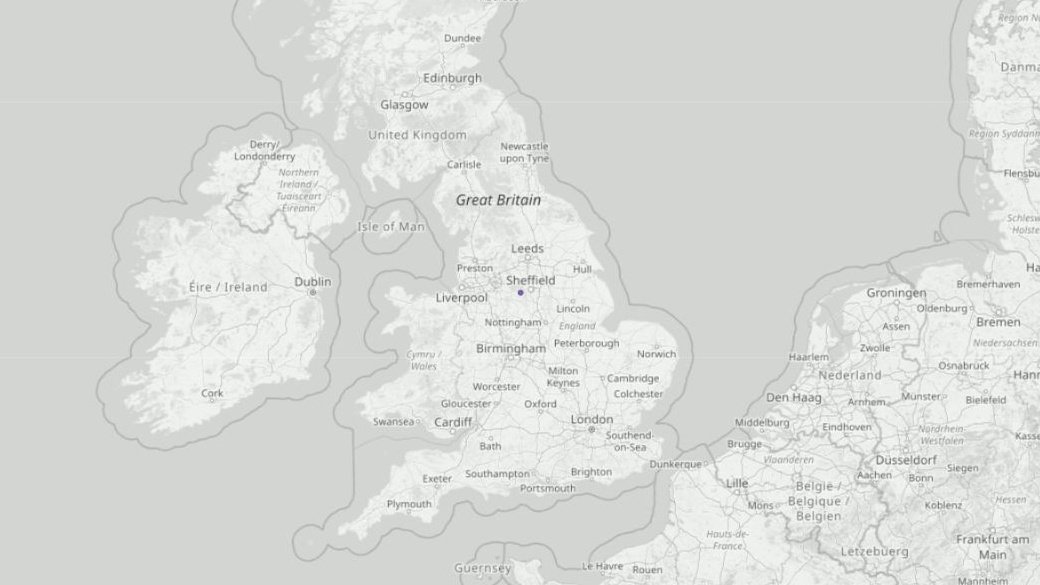
5 February 2025 · No direct match · observation confidence 10/10
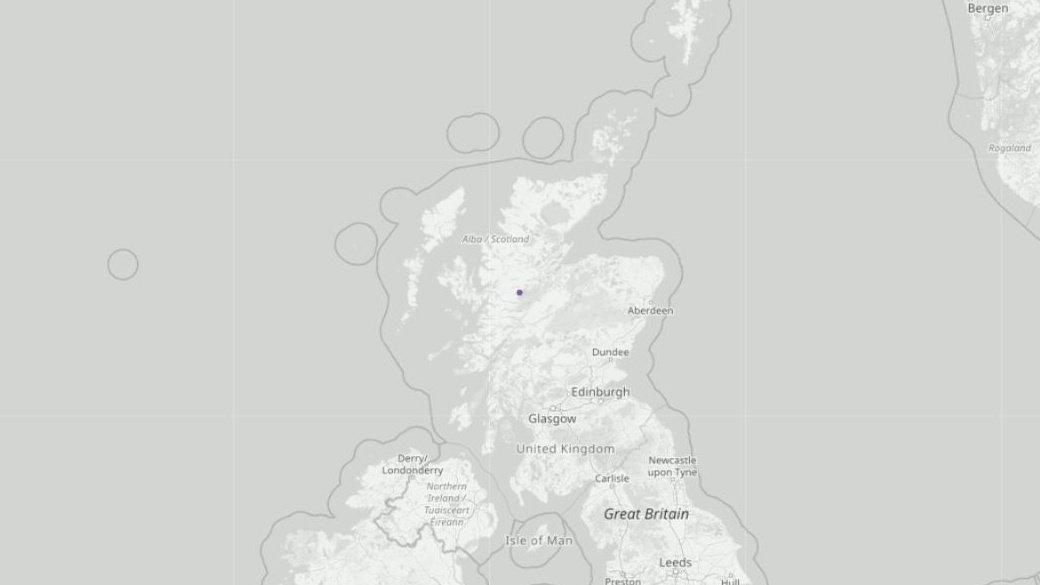
10 November 2024 · No direct match · observation confidence 10/10
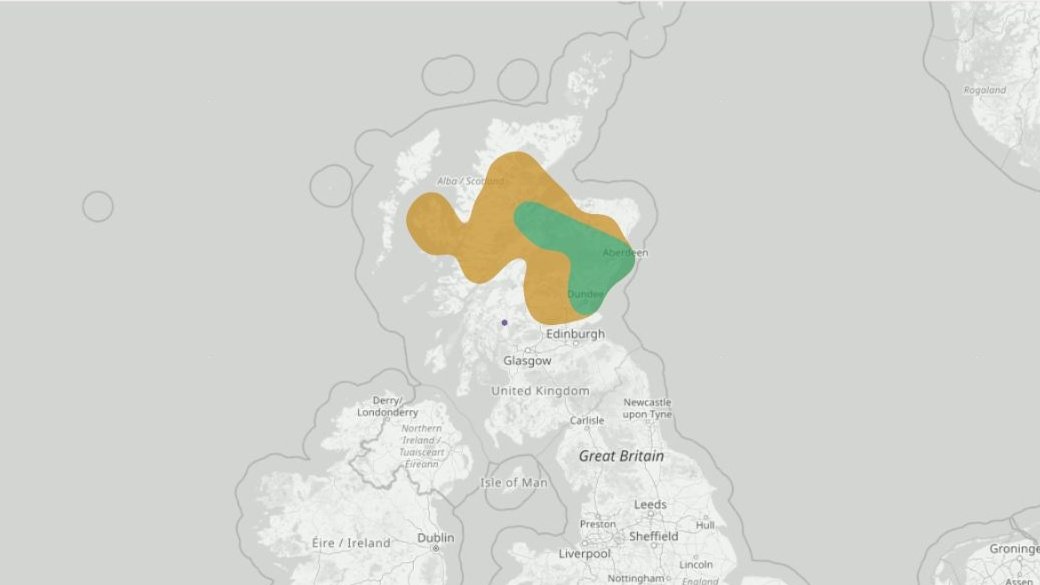
23 September 2024 · No direct match · observation confidence 10/10
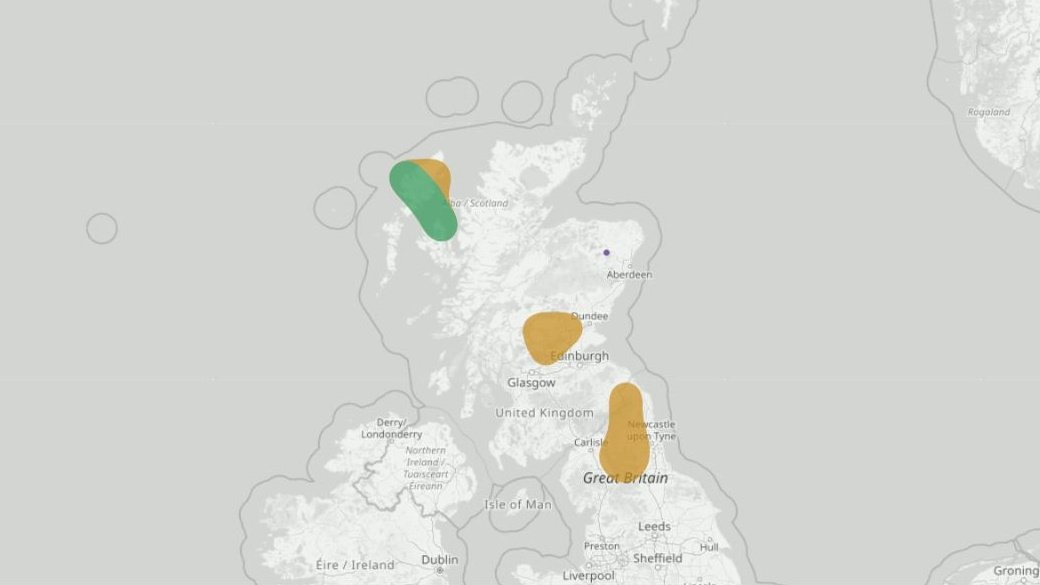
7 September 2024 · No direct match · observation confidence 10/10
READ THE RECORD FAIRLY
The observation date and source describe what was seen. Each map applies the current WeatherDuck blob formula and the live 25 km area geometry to the retained historical valid-time input. A direct match means the location point falls inside that coloured area; it does not prove every nearby summit or valley experienced the same conditions.
Possible, Likely and Very likely are model bands, not calibrated percentage probabilities. No-direct-match events remain in the archive so the record does not hide weaker outcomes.